Question: Please help me with a, b, c, and d % Problem 6s. 10 Refer to Table 56.1 - Factors for Computing Control Chart Uimts (3

Please help me with a, b, c, and d Please help me with a, b, c, and d % Problem 6s.
% Problem 6s. 10 Refer to Table 56.1 - Factors for Computing Control Chart Uimts (3 sigma) for this problem A process that is considered to be in control measures an ingredient in ounces. Below are the last 10 samples (each of size n = 5) taken. The population process standard deviation is 1.20. Samples 1 2 3 4 5 8 10 9 14 a 11 10 8 10 10 16 11 8 7 10 9 12 11 10 10 8 11 10 11 9 12 9 10 12 10 11 10 10 11 9 8 53 11 8 10 8 11 7 7 11 51 8 7 10 13 a) Stardard deviation of the sampling means 637 ounces (round your response to three decimal placea) b) Wezx3, the control limits for the mean chart are UCL, 12 conces (round your response to three deom pleco LCL - 2014 ounce found your response to three decimal places .) The controllimits for the R-chart are UCUR 688 ounces (round your response to the decimal places LCL = 0.000 ounces (round your response to to the decimal places) d) Based on the x-chart, is one or more samples beyond the controllimis? No Based on the R-chart one or more samples beyond the controllimits? Yes

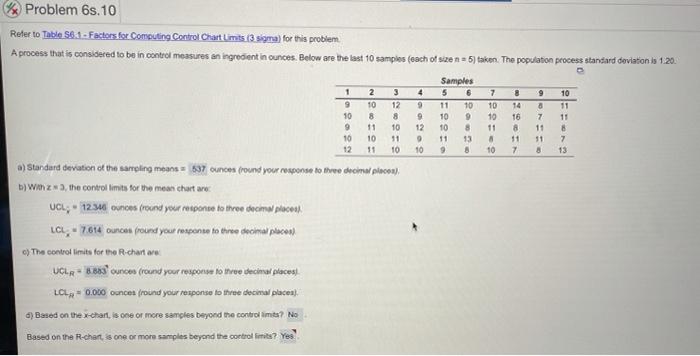
Step by Step Solution

There are 3 Steps involved in it

1 Expert Approved Answer
Step: 1 Unlock blur-text-image
Question Has Been Solved by an Expert!

Get step-by-step solutions from verified subject matter experts

Step: 2 Unlock
Step: 3 Unlock

Students Have Also Explored These Related General Management Questions!