

Question: Please help me with the Python code for above problem. Problem 2 A polynomial p(t) of degree n is defined as: P) = ant +
 Please help me with the Python code for above problem.
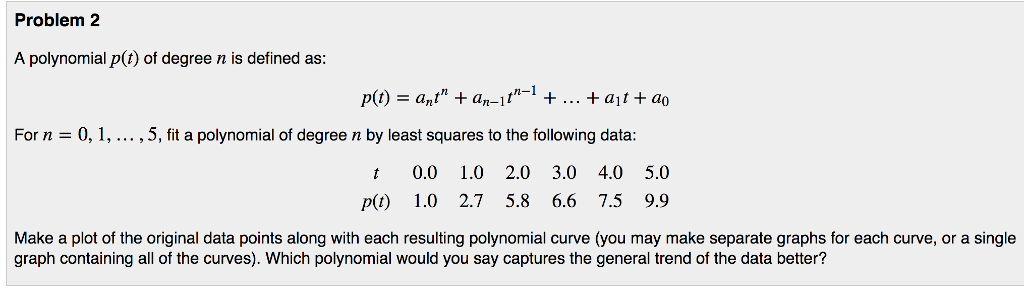
Problem 2 A polynomial p(t) of degree n is defined as: P) = ant" + ant-1+ ... +at+ a For n = 0, 1, ...,polynomial of n least to data: 5, fit a degree by squares the following t 0.0 1.0 2.0 3.0 4.0 5.0 p) 1.0 2.7 5.8 6.6 .5 9.9 Make a plot of the original data points along with each resulting polynomial curve (you may make separate graphs for each curve, or a single graph containing all of the curves). Which polynomial would you say captures the general trend of the data better
Step by Step Solution
There are 3 Steps involved in it
1 Expert Approved Answer
Step: 1 Unlock

Question Has Been Solved by an Expert!
Get step-by-step solutions from verified subject matter experts
Step: 2 Unlock
Step: 3 Unlock