

Question: please help me with this Definition Based on the x-chart, the wire cutting process has been The control limits for the 3-sigma R-chart are (cound
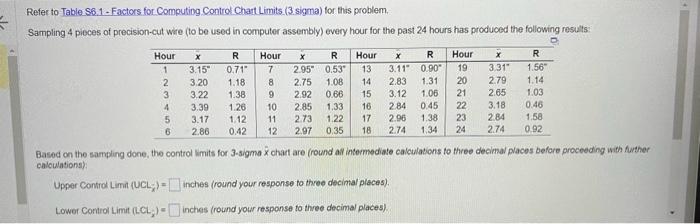
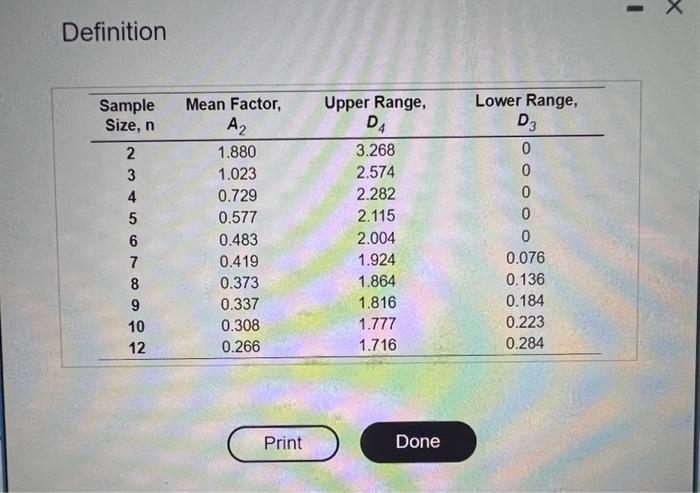
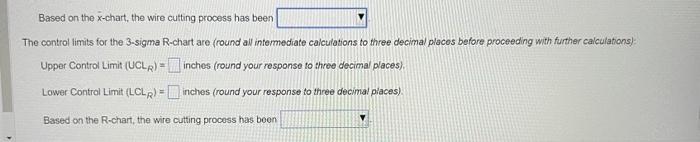
Definition Based on the x-chart, the wire cutting process has been The control limits for the 3-sigma R-chart are (cound all intermediate calculations to three decimal placos before proceeding with further calculations): Upper Control Limit (UCL ULR)= inches (round your response to throe decimal places), Lower Control Limit (LCLR)= inches (round your response to three decima! places). Based on the R-chart, the wire cutting procoss has boon tefer to Table S6.1 - Factors for. Computing Control Chart Limits. (3 sigma) for this problem. Sampling 4 pieces of precision-cut wre (to be used in computer assembly) every hour for the past 24 hours has produced the following results: Based on the sampling done, the control imits for 3-sigma x chact are fround ail intermediate calculations to three decimal places before proceeding with further caloulations): Upper Control Limit (UL)=inches (round your response to three decintal places). Lower Control Limit (L.CL, )= inches (round your response to three decimal places)
Step by Step Solution
There are 3 Steps involved in it

Get step-by-step solutions from verified subject matter experts