

Question: Please help me with this question and show work please, thank you! Consider an order handling process with different causes of errors and the corresponding
Please help me with this question and show work please, thank you!
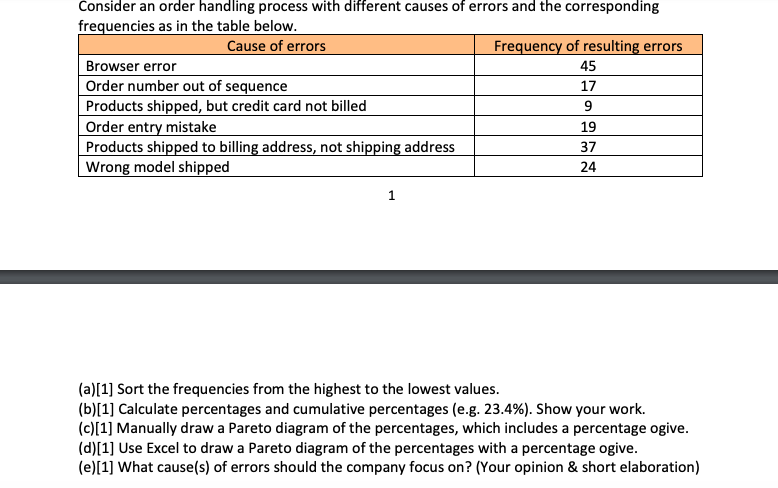
Consider an order handling process with different causes of errors and the corresponding freauencies as in the table below. F 1 (a)[1] Sort the frequencies from the highest to the lowest values. (b) [1] Calculate percentages and cumulative percentages (e.g. 23.4\%). Show your work. (c) [1] Manually draw a Pareto diagram of the percentages, which includes a percentage ogive. (d)[1] Use Excel to draw a Pareto diagram of the percentages with a percentage ogive. (e)[1] What cause(s) of errors should the company focus on? (Your opinion \& short elaboration)Step by Step Solution
There are 3 Steps involved in it
1 Expert Approved Answer
Step: 1 Unlock

Question Has Been Solved by an Expert!
Get step-by-step solutions from verified subject matter experts
Step: 2 Unlock
Step: 3 Unlock