

Question: please help out with this question, all the answers on the picture is wrong. Thank you. begin{tabular}{lccccccccccccccc} hline Sample & 1 & 2 & 3
please help out with this question, all the answers on the picture is wrong. Thank you.
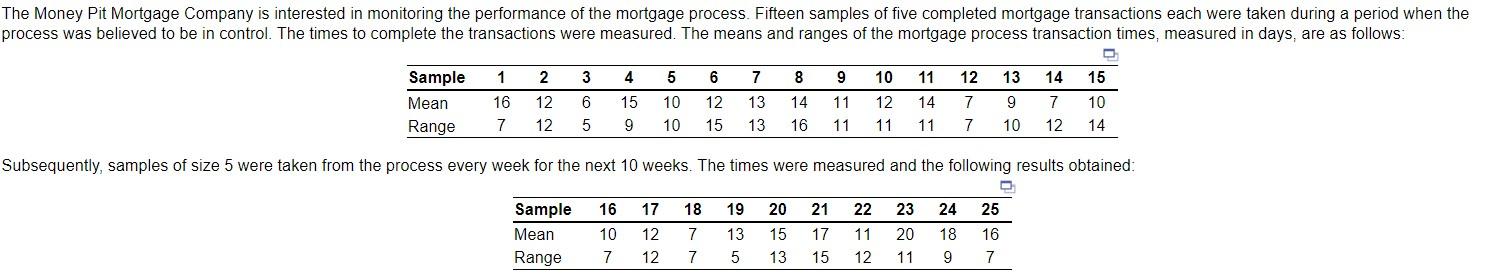
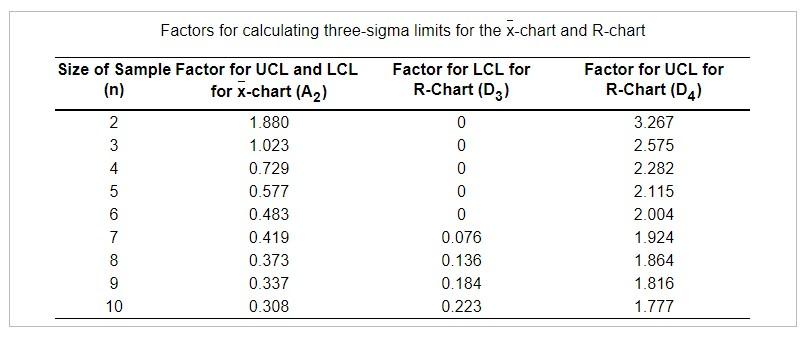
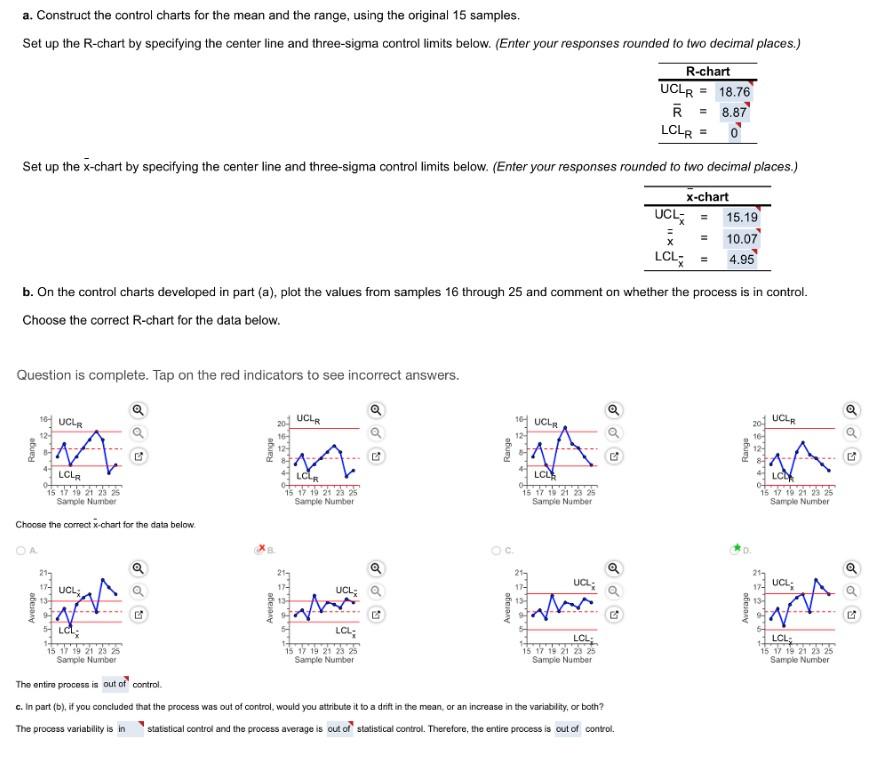
\begin{tabular}{lccccccccccccccc} \hline Sample & 1 & 2 & 3 & 4 & 5 & 6 & 7 & 8 & 9 & 10 & 11 & 12 & 13 & 14 & 15 \\ \hline Mean & 16 & 12 & 6 & 15 & 10 & 12 & 13 & 14 & 11 & 12 & 14 & 7 & 9 & 7 & 10 \\ Range & 7 & 12 & 5 & 9 & 10 & 15 & 13 & 16 & 11 & 11 & 11 & 7 & 10 & 12 & 14 \\ \hline \end{tabular} Subsequently, samples of size 5 were taken from the process every week for the next 10 weeks. The times were measured and the following results obtained: \begin{tabular}{lcccccccccc} \hline Sample & 16 & 17 & 18 & 19 & 20 & 21 & 22 & 23 & 24 & 25 \\ \hline Mean & 10 & 12 & 7 & 13 & 15 & 17 & 11 & 20 & 18 & 16 \\ Range & 7 & 12 & 7 & 5 & 13 & 15 & 12 & 11 & 9 & 7 \\ \hline \end{tabular} Factors for calculating three-sigma limits for the x-chart and R-chart a. Construct the control charts for the mean and the range, using the original 15 samples. Set up the R-chart by specifying the center line and three-sigma control limits below. (Enter your responses rounded to two decimal places.) Set up the x-chart by specifying the center line and three-sigma control limits below. (Enter your responses rounded to two decimal places.) b. On the control charts developed in part (a), plot the values from samples 16 through 25 and comment on whether the process in control. Choose the correct R-chart for the data below. Question is complete. Tap on the red indicators to see incorrect answers. Choose the correct x-chart for the data below. A. x1 C. thn The entira process is control. c. In part (b), if you concluded that the process was out of control, would you attribute it to a drift in the mean, or an increase in the variability, or both? The process variability is statstical control and the process average is statistical control. Therefore, the entire process is controlStep by Step Solution
There are 3 Steps involved in it
1 Expert Approved Answer
Step: 1 Unlock

Question Has Been Solved by an Expert!
Get step-by-step solutions from verified subject matter experts
Step: 2 Unlock
Step: 3 Unlock