

Question: please help please please Summary Statistics XLF XLB Average 3.30% 2.11% Variance 0.002034 0.001182 St Dev 4,51% 3,44% Covariance 0.000977 Correlation 0.63035 RE 0.11% Sharpe
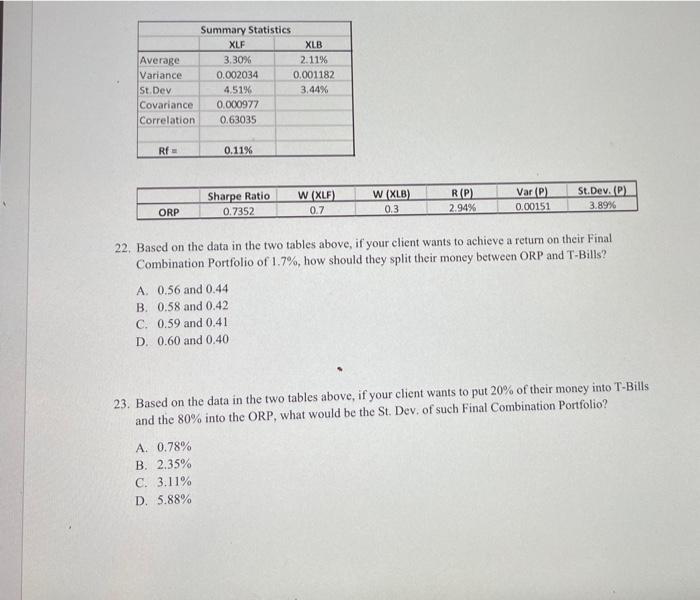
Summary Statistics XLF XLB Average 3.30% 2.11% Variance 0.002034 0.001182 St Dev 4,51% 3,44% Covariance 0.000977 Correlation 0.63035 RE 0.11% Sharpe Ratio 0.7352 W (XLF) 0.7 W (XLB) 0.3 R(P) 2.94% Var(P) 0.00151 St.Dev. (0) 3.89% ORP 22. Based on the data in the two tables above, if your client wants to achieve a return on their Final Combination Portfolio of 1.7%, how should they split their money between ORP and T-Bills? A 0.56 and 0.44 B. 0.58 and 0.42 C. 0.59 and 0.41 D. 0.60 and 0.40 23. Based on the data in the two tables above, if your client wants to put 20% of their money into T-Bills and the 80% into the ORP, what would be the St. Dev. of such Final Combination Portfolio? A. 0.78% B. 2.35% C. 3.11% D. 5.88%
Step by Step Solution
There are 3 Steps involved in it

Get step-by-step solutions from verified subject matter experts