

Question: Please help! Please provide excel steps! I will like! = Landseaping Expenditures {$1,000) (b) What does the scatter plot developed in port (a) indicate about
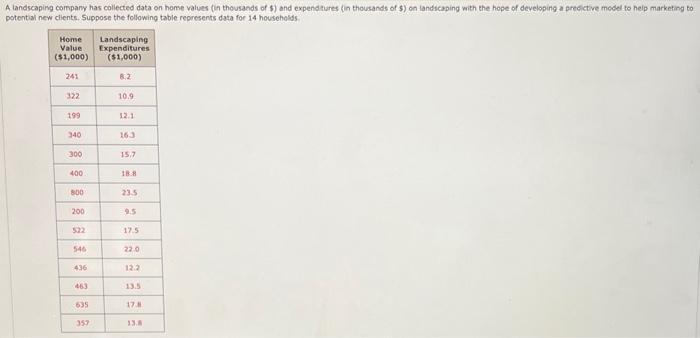
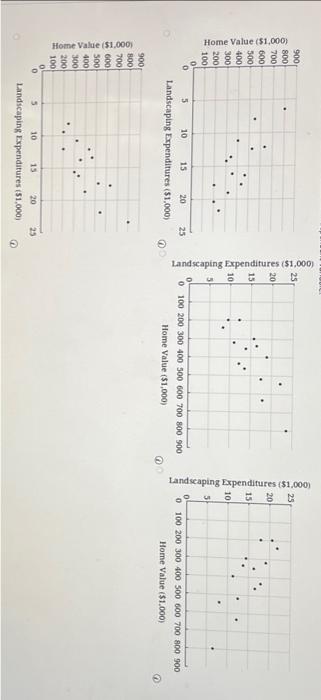
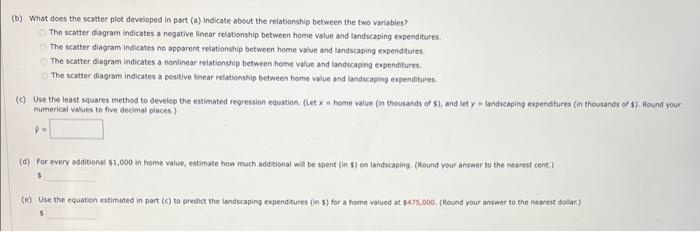
= Landseaping Expenditures {$1,000) (b) What does the scatter plot developed in port (a) indicate about the reiationship between the two variables? The scatter dagram indicates a negative linear relationship between home value and tandscaping expenditures. The scatter diagram indicates no apparent relationship between home value and londscaping expendtures. The seatter diagram indicates a nonlinear relationship between home value and landscaping evpenditures. The scatter diagram indicates a povilive linear relationchip between home value and landscaping enpenditures (c) Use the least squares method to develep the estimated regression equation. (Let x= home value (in thevsands of s), and let y= landicaping expendeures (in thousands of 5). Round your numerical values to five decimal places.) = (d) For every additional 51,000 in home value, estimate how much additional will be spent (in $ ) on tandicaping. (Nound yeur answer to the nearest cent.) (c) Use the equation estimated in part (c) to predict the indscaping expengitures (in \$) for a home valued at su75,000. (Round your answer to the nearest dolar) = Landseaping Expenditures {$1,000) (b) What does the scatter plot developed in port (a) indicate about the reiationship between the two variables? The scatter dagram indicates a negative linear relationship between home value and tandscaping expenditures. The scatter diagram indicates no apparent relationship between home value and londscaping expendtures. The seatter diagram indicates a nonlinear relationship between home value and landscaping evpenditures. The scatter diagram indicates a povilive linear relationchip between home value and landscaping enpenditures (c) Use the least squares method to develep the estimated regression equation. (Let x= home value (in thevsands of s), and let y= landicaping expendeures (in thousands of 5). Round your numerical values to five decimal places.) = (d) For every additional 51,000 in home value, estimate how much additional will be spent (in $ ) on tandicaping. (Nound yeur answer to the nearest cent.) (c) Use the equation estimated in part (c) to predict the indscaping expengitures (in \$) for a home valued at su75,000. (Round your answer to the nearest dolar)
Step by Step Solution
There are 3 Steps involved in it

Get step-by-step solutions from verified subject matter experts