

Question: please help Random samples that are drawn independently from two normally distributed populations yielded the following statistics. Group 1 Group 2 n = 12 n,
please help
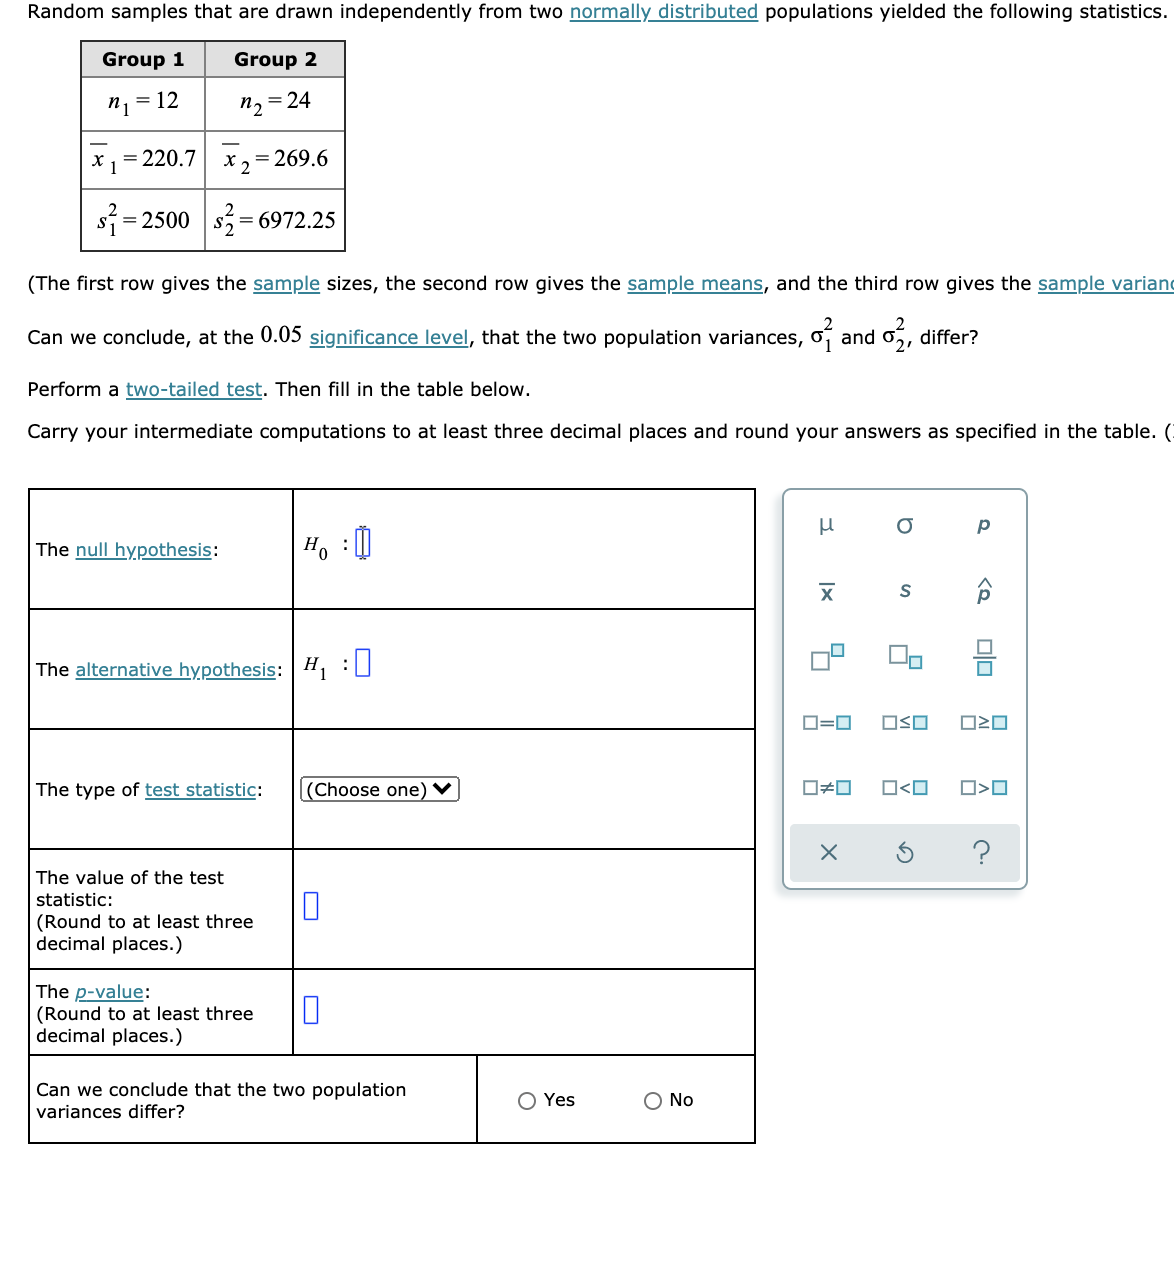
Random samples that are drawn independently from two normally distributed populations yielded the following statistics. Group 1 Group 2 n = 12 n, = 24 x =220.7 x 2 =269.6 S7 = 2500 S2 = 6972.25 (The first row gives the sample sizes, the second row gives the sample means, and the third row gives the sample varian Can we conclude, at the 0.05 significance level, that the two population variances, of and 2, differ? Perform a two-tailed test. Then fill in the table below. Carry your intermediate computations to at least three decimal places and round your answers as specified in the table. ( P The null hypothesis: Ho : !I X S P The alternative hypothesis: H :0 0=0 OSO 020 The type of test statistic: (Choose one) v] *0 00 X 5 ? The value of the test statistic: (Round to at least three 0 decimal places. The p-value: (Round to at least three 0 decimal places.) Can we conclude that the two population variances differ? O Yes O No
Step by Step Solution
There are 3 Steps involved in it

Get step-by-step solutions from verified subject matter experts