

Question: Random samples that are drawn independently from two normally distributed populations yielded the following statistics. Group 1 Group 2 s? = 2190.24 s= 930.25 (The
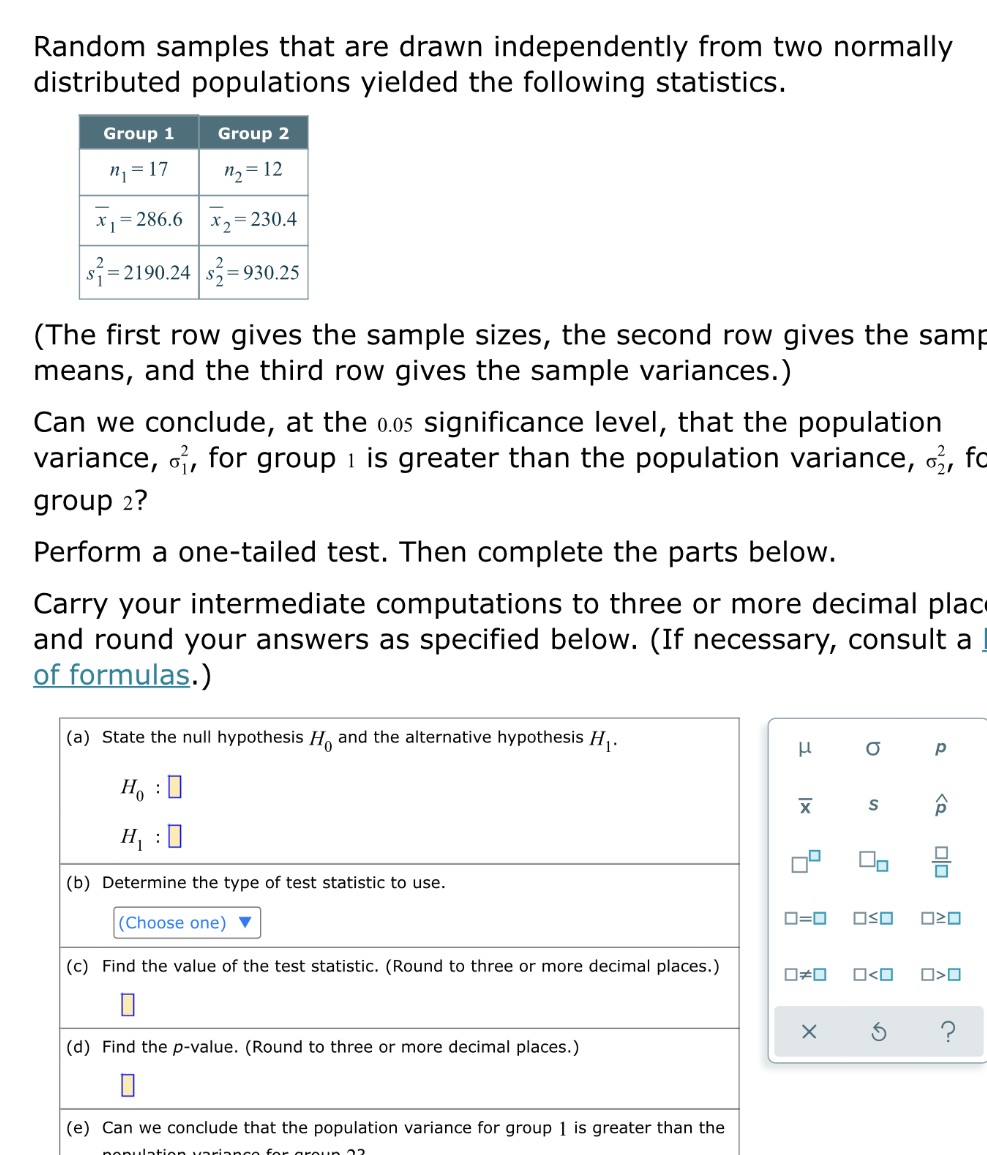
Random samples that are drawn independently from two normally distributed populations yielded the following statistics. Group 1 Group 2 s? = 2190.24 s= 930.25 (The first row gives the sample sizes, the second row gives the 5am: means, and the third row gives the sample variances.) Can we conclude, at the 0.05 significance level, that the population variance, 5?, for group 1 is greater than the population variance, 5:, fc group 2? Perform a one-tailed test. Then complete the parts below. Carry your intermediate computations to three or more decimal plac: and round your answers as specified below. (If necessary, consult a J of formulas.) (a) State the null hypothesis H0 and the alternative hypothesis H1, (b) Determine the type of test statistic to use. (Choose one) Y (c) Find the value of the test statistic. (Round to three or more decimal places.) I] (d) Find the p-value. (Round to three or more decimal places.) III (e) Can we conclude that the population variance for group 1 is greater than the nal-Inhinn nHu-ihnrn 'hu urn-In '1
Step by Step Solution
There are 3 Steps involved in it

Get step-by-step solutions from verified subject matter experts