

Question: Please help solve In 2017, a journal reported on trends in sugar-sweetened beverage (SSB) consumption. A random sample of youths aged 12 to 19 years
Please help solve
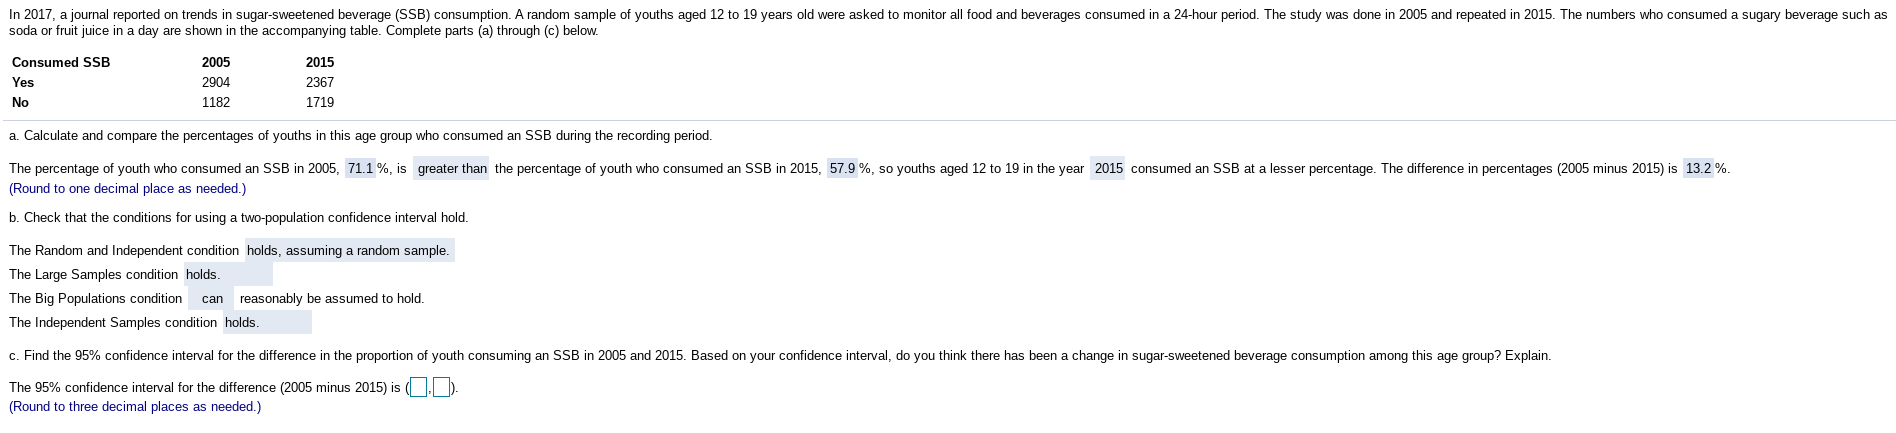
In 2017, a journal reported on trends in sugar-sweetened beverage (SSB) consumption. A random sample of youths aged 12 to 19 years old were asked to monitor all food and beverages consumed in a 24-hour period. The study was done in 2005 and repeated in 2015. The numbers who consumed a sugary beverage such as soda or fruit juice in a day are shown in the accompanying table. Complete parts (a) through (c) below. Consumed SSB 2005 2015 Yes 2904 2367 No 1182 1719 a. Calculate and compare the percentages of youths in this age group who consumed an SSB during the recording period. The percentage of youth who consumed an SSB in 2005, 71.1 %, is greater than the percentage of youth who consumed an SSB in 2015, 57.9 %, so youths aged 12 to 19 in the year 2015 consumed an SSB at a lesser percentage. The difference in percentages (2005 minus 2015) is 13.2%. (Round to one decimal place as needed.) b. Check that the conditions for using a two-population confidence interval hold. The Random and Independent condition holds, assuming a random sample. The Large Samples condition holds. The Big Populations condition can reasonably be assumed to hold. The Independent Samples condition holds. c. Find the 95% confidence interval for the difference in the proportion of youth consuming an SSB in 2005 and 2015. Based on your confidence interval, do you think there has been a change in sugar-sweetened beverage consumption among this age group? Explain. The 95% confidence interval for the difference (2005 minus 2015) is (].). (Round to three decimal places as needed.)
Step by Step Solution
There are 3 Steps involved in it

Get step-by-step solutions from verified subject matter experts