

Question: Please help solving this problem. The following table shows tetanus vaccination rates vs tetanus related deaths per 100 000 people for 6 countries. at =
Please help solving this problem.
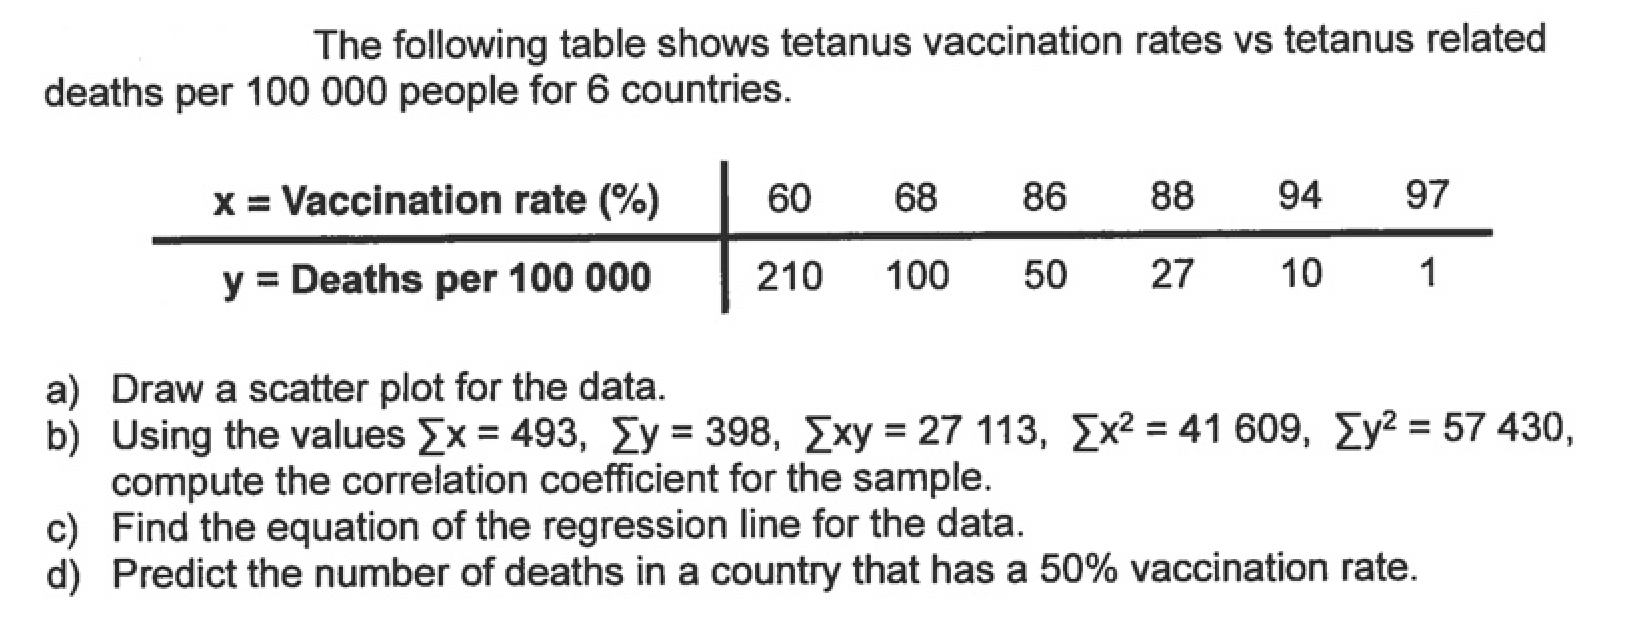
The following table shows tetanus vaccination rates vs tetanus related deaths per 100 000 people for 6 countries. at = Vaccination rate ($3) 60 68 86 38 94 97 y = Deaths per 100 000 210 100 5D 2? 10 1 a) Draw a scatter plot for the data. b) Using the values {it = 493. Z)! = 398. {xv = 27 113, 2:3 = 41 609. 29'? = 57 430, compute the con'elation coefcient for the sample. c) Find the equation of the regression line for the data. d) Predict the number of deaths in a country that has a 50% vaccination rate
Step by Step Solution
There are 3 Steps involved in it
1 Expert Approved Answer
Step: 1 Unlock

Question Has Been Solved by an Expert!
Get step-by-step solutions from verified subject matter experts
Step: 2 Unlock
Step: 3 Unlock