

Question: please help. The table correlates with the question. Thanks in advance AMZN Summary Statistics AAPL Average 3.33% Variance 0.007992 St. Dev. 8.94% Covariance 0.003339 Correlation
please help. The table correlates with the question. Thanks in advance 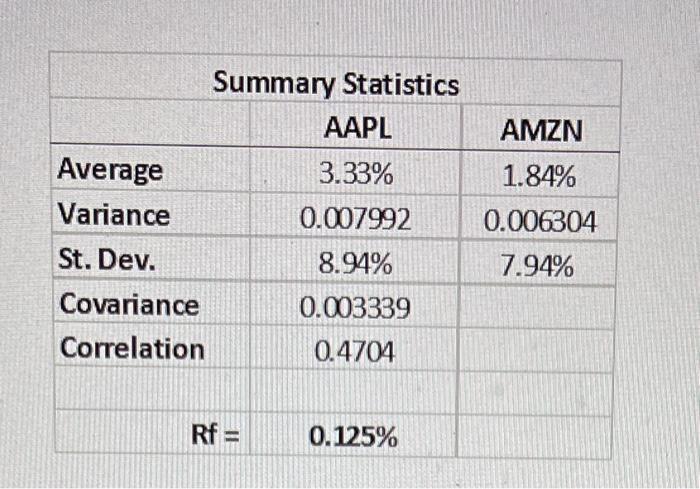
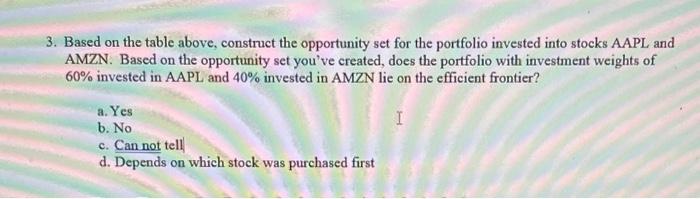
AMZN Summary Statistics AAPL Average 3.33% Variance 0.007992 St. Dev. 8.94% Covariance 0.003339 Correlation 0.4704 1.84% 0.006304 7.94% Rf= 0.125% 3. Based on the table above, construct the opportunity set for the portfolio invested into stocks AAPL and AMZN. Based on the opportunity set you've created, does the portfolio with investment weights of 60% invested in AAPL and 40% invested in AMZN lie on the efficient frontier? a. Yes I b. No c. Can not tell d. Depends on which stock was purchased first
Step by Step Solution
There are 3 Steps involved in it
1 Expert Approved Answer
Step: 1 Unlock

Question Has Been Solved by an Expert!
Get step-by-step solutions from verified subject matter experts
Step: 2 Unlock
Step: 3 Unlock