

Question: Please help with number 8, and only use Python language 5): import numpy as np X = np.random.randint(0, 10, 30) print(The original array: ) print
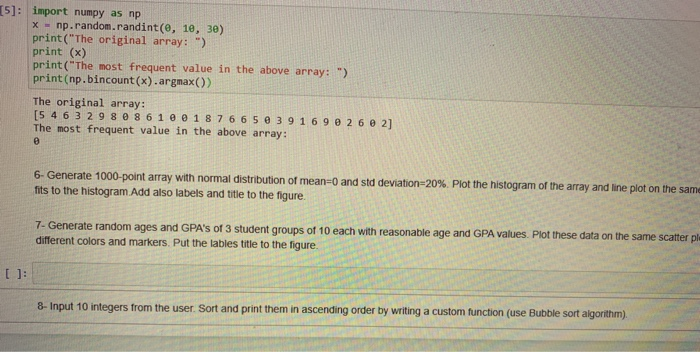
5): import numpy as np X = np.random.randint(0, 10, 30) print("The original array: ") print (x) print("The most frequent value in the above array: ") print(np.bincount(x).argmax() The original array: [5 4 6 3 2 9 8 0 8 610 @ 1 8 7 6 6 5 0 3 9 1 6 9 0 26 0 2] The most frequent value in the above array: 6. Generate 1000-point array with normal distribution of mean fits to the histogram Add also labels and title to the figure. and std deviation=20%. Plot the histogram of the array and line plot on the same 7- Generate random ages and GPA's of 3 student groups of 10 each with reasonable age and GPA values. Plot these data on the same scatter pl different colors and markers. Put the lables title to the figure. 8- Input 10 integers from the user. Sort and print them in ascending order by writing a custom function (use Bubble sort algorithm)
Step by Step Solution
There are 3 Steps involved in it

Get step-by-step solutions from verified subject matter experts