Question: Please help with questions (A-I) and also, find the upper and lower bound. Thank you. Six different national brands of chocolate chip cookies were randomly
Please help with questions (A-I) and also, find the upper and lower bound. Thank you.
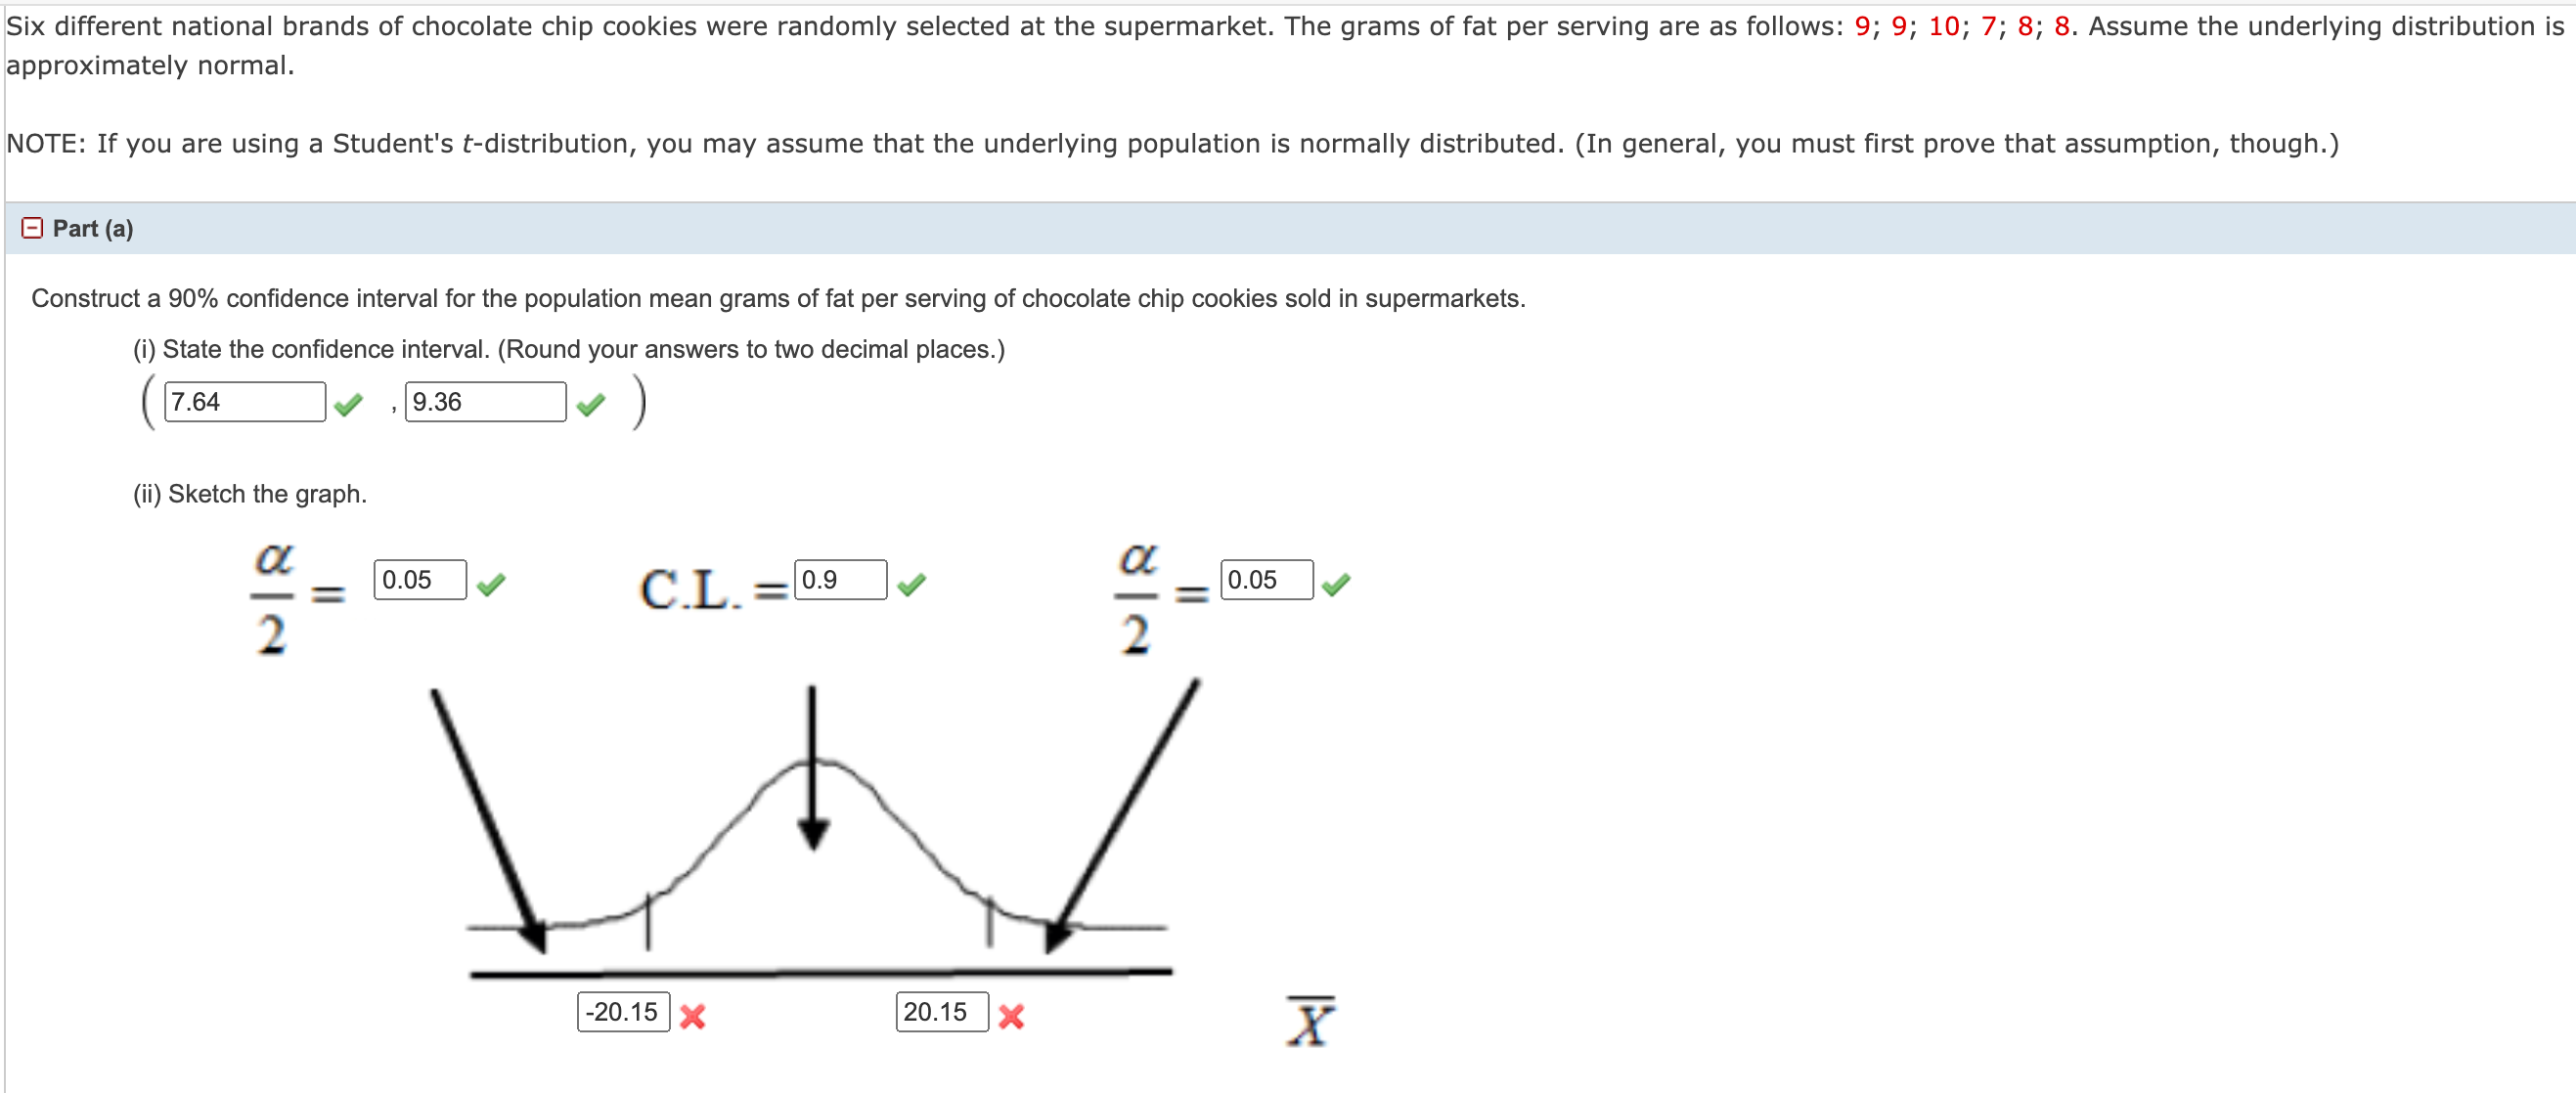
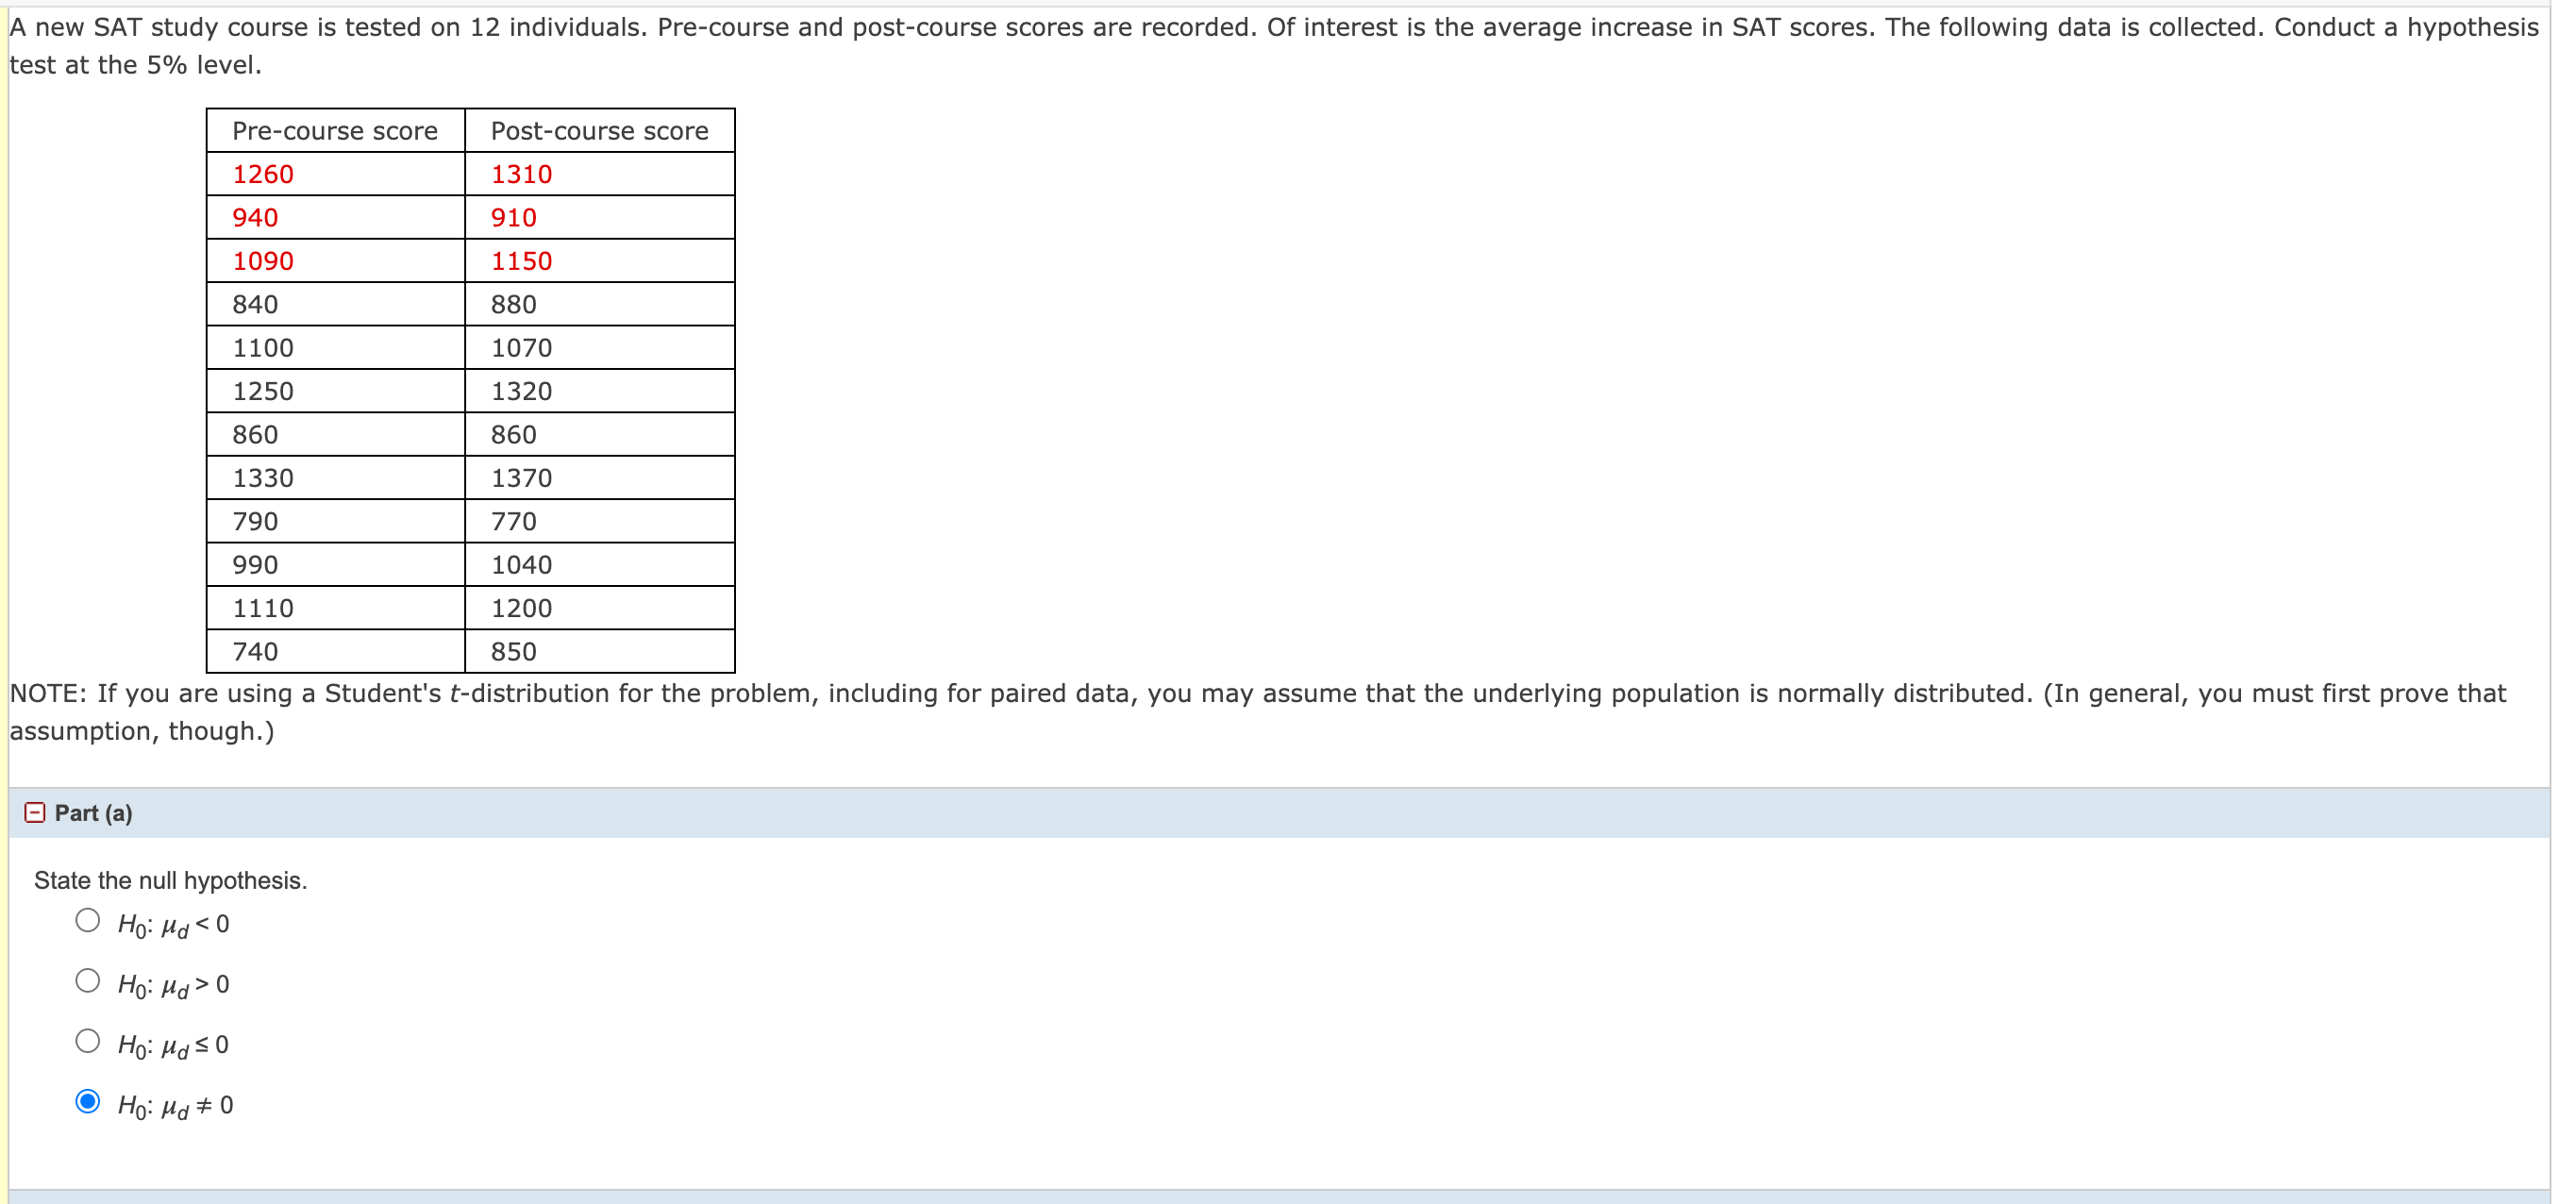
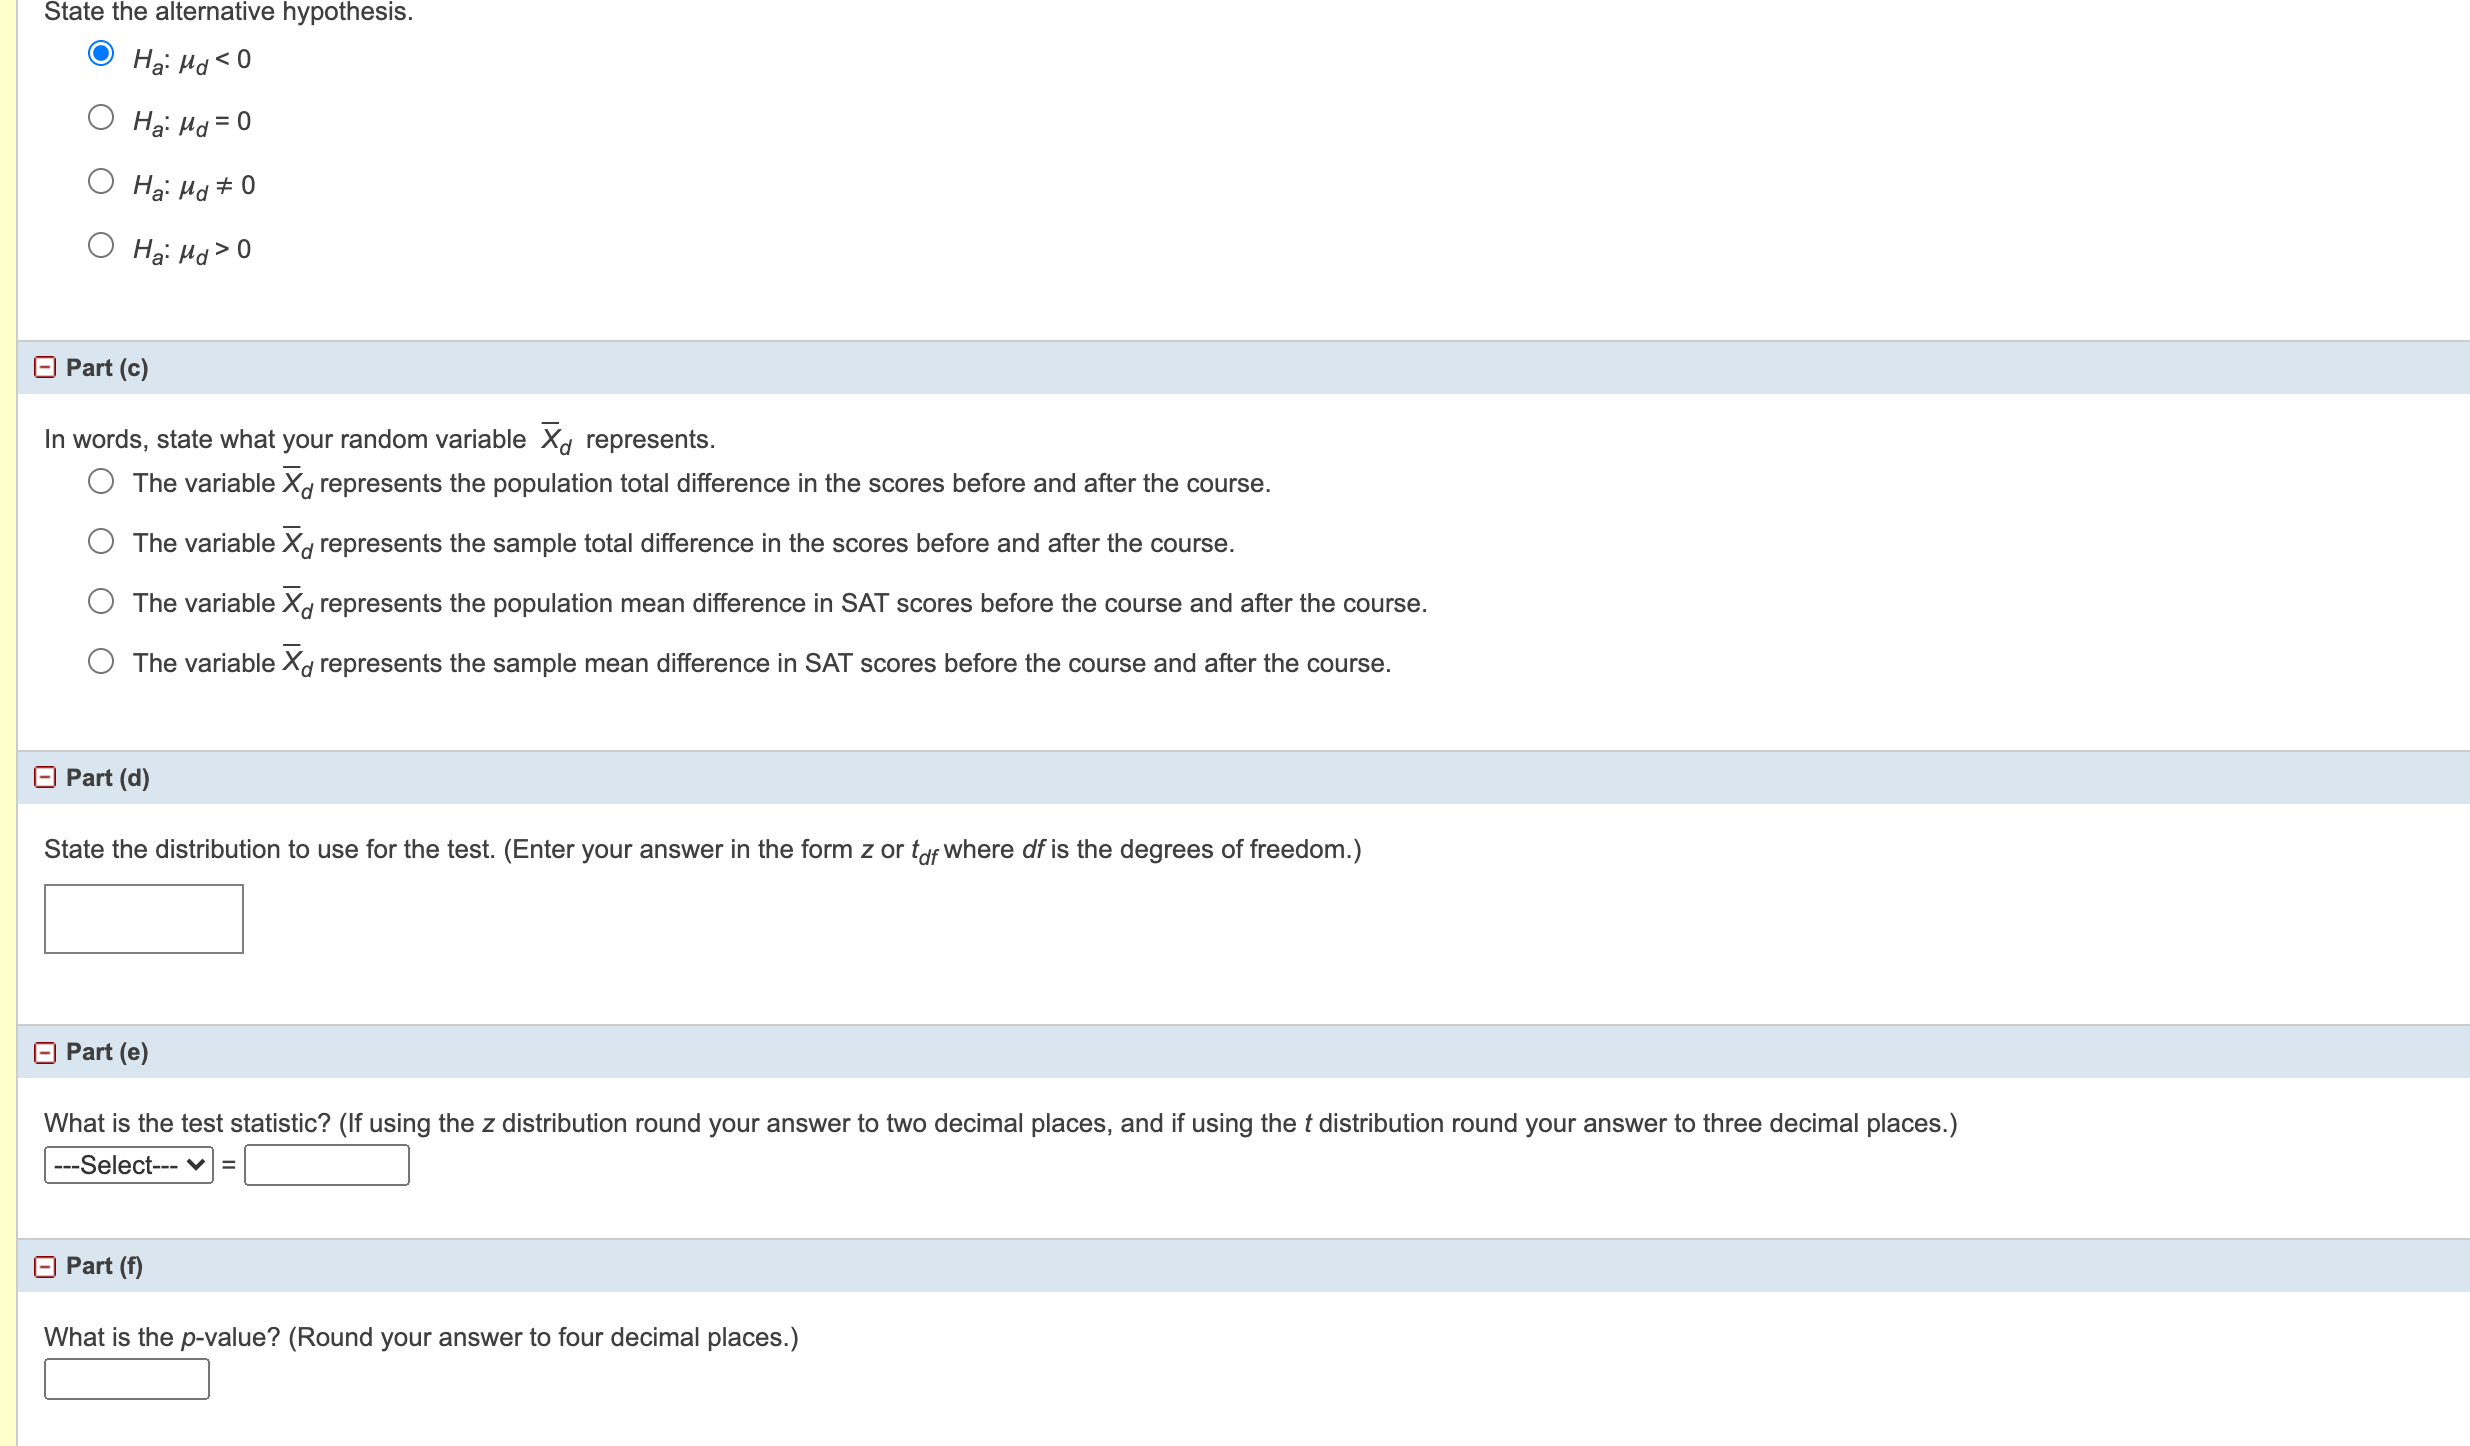
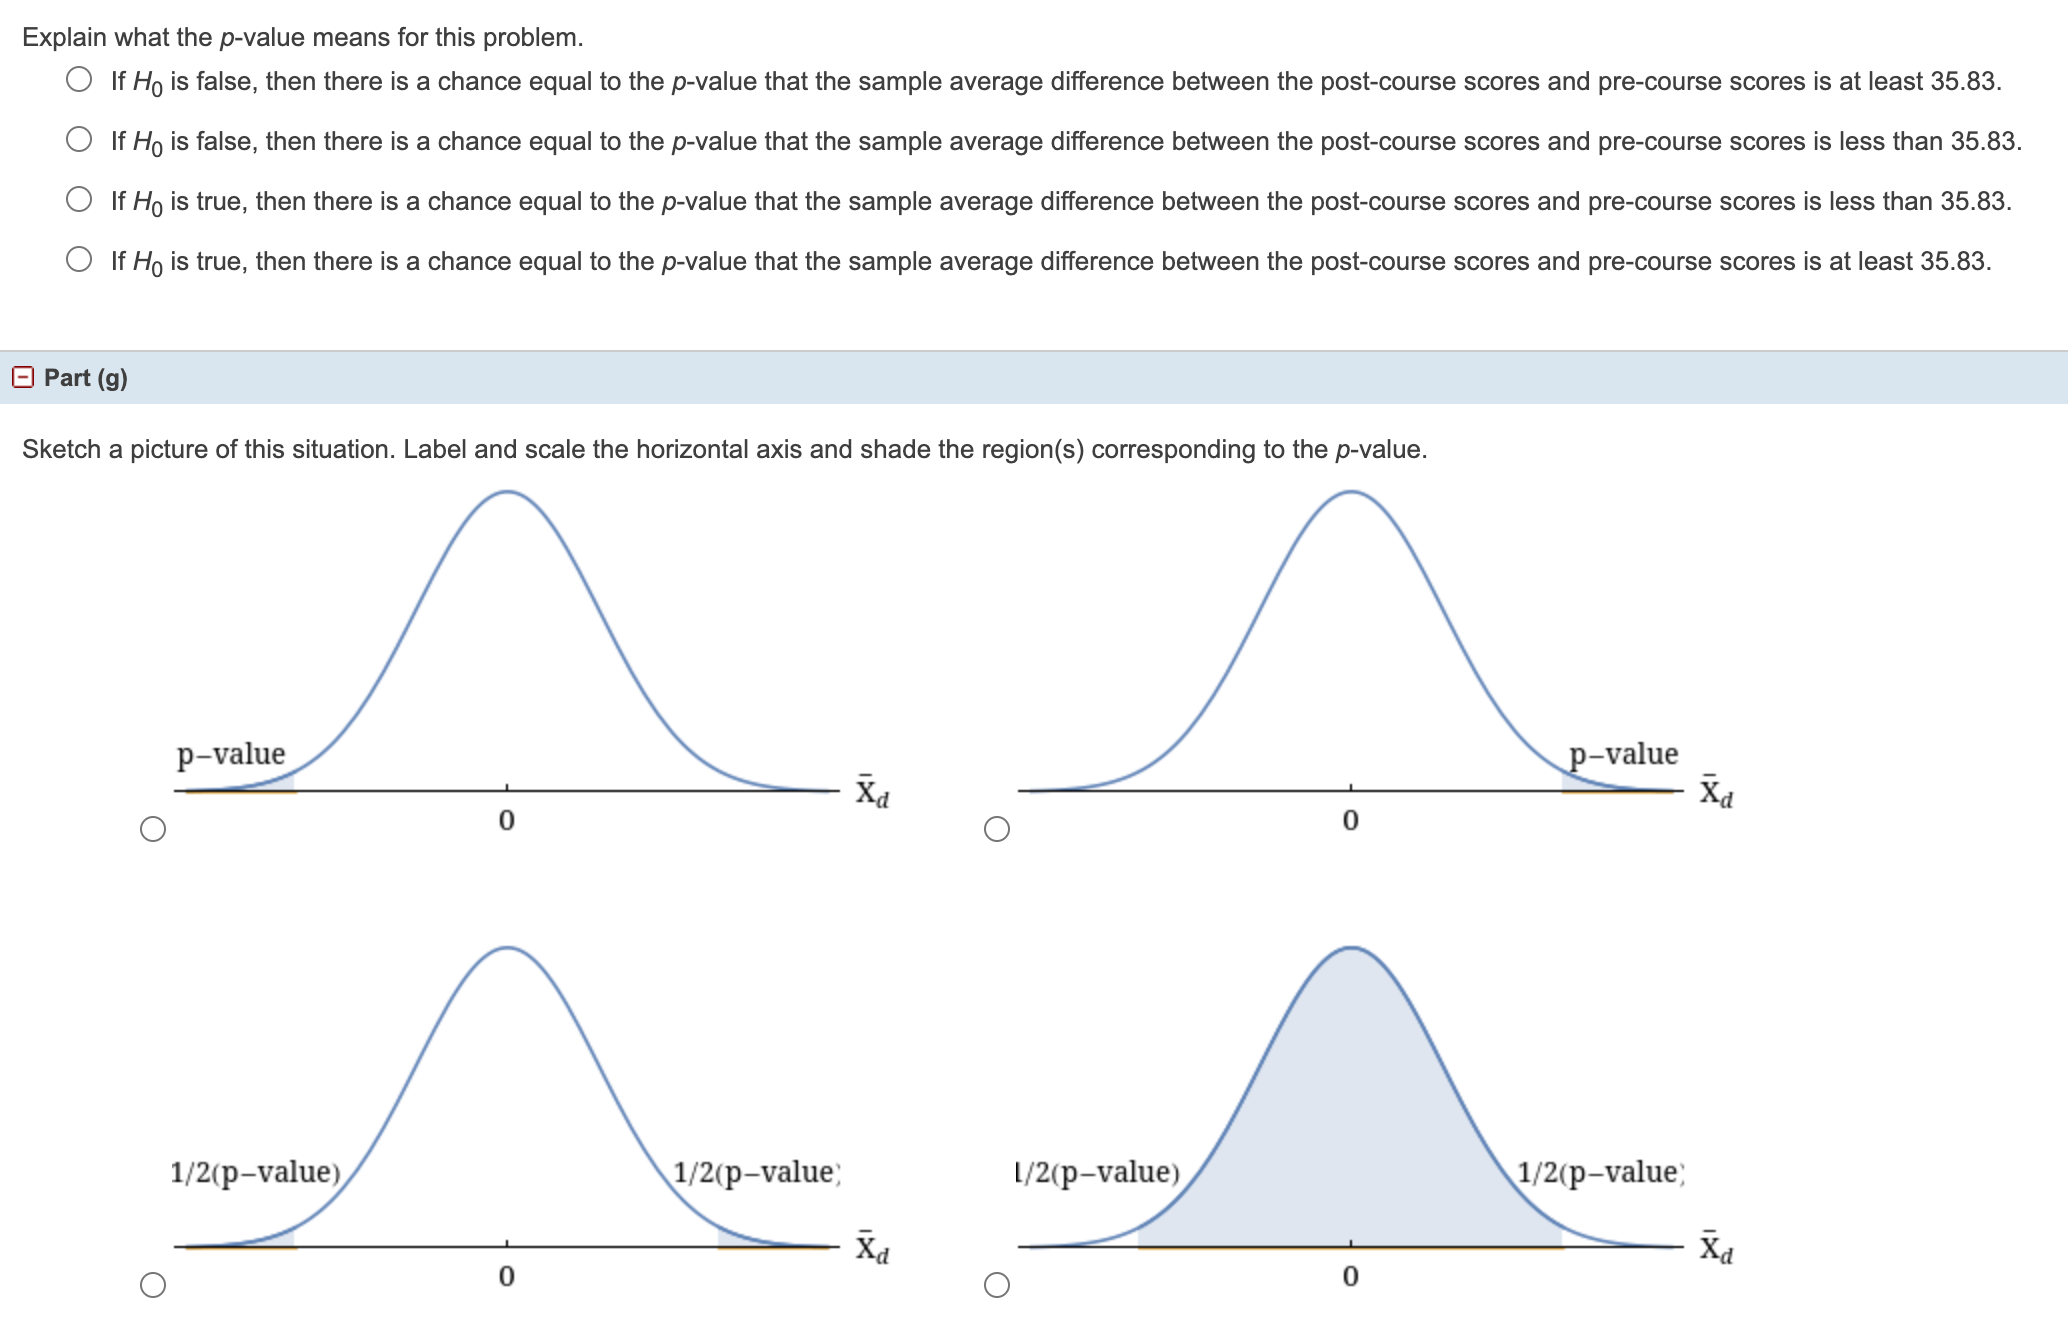
Six different national brands of chocolate chip cookies were randomly selected at the supermarket. The grams of fat per serving are as follows: 9; 9; 10; 7; 8; 8. Assume the underlying distribution is approximately normal. NOTE: If you are using a Student's t-distribution, you may assume that the underlying population is normally distributed. (In general, you must first prove that assumption, though.) Part (a) Construct a 90% confidence interval for the population mean grams of fat per serving of chocolate chip cookies sold in supermarkets. (i) State the confidence interval. (Round your answers to two decimal places.) (7.64 9.36 (ii) Sketch the graph. 0.05 C.L. = 0.9 = 0.05 -20.15 X 20.15 X XA new SAT study course is tested on 12 individuals. Pre-course and post-course scores are recorded. Of interest is the average increase in SAT scores. The following data is collected. Conduct a hypothesis test at the 5% level. Pre-course score Post-course score 1260 1310 94 910 1090 1150 840 880 1100 1070 1250 1320 860 860 1330 1370 790 770 990 1040 1110 1200 740 850 NOTE: If you are using a Student's t-distribution for the problem, including for paired data, you may assume that the underlying population is normally distributed. (In general, you must first prove that assumption, though.) Part (a) State the null hypothesis. O Ho: Hd 0 O Ho : Maso O Ho: Md # 0State the alternative hypothesis. Ha: I'd 0 _ In words, state what your random variable 7;, represents. 0 The variable Yd represents the population total difference in the scores before and after the course. 0 The variable X, represents the sample total difference in the scores before and after the oourse. O The variable Yd represents the population mean difference in SAT scores before the course and after the course. 0 The variable X, represents the sample mean difference in SAT scores before the course and after the course. State the distribution to use for the test. (Enter your answer in the form 2 or tdfwhere df is the degrees of freedom.) What is the test statistic? (If using the 1 distribution round your answer to two decimal places, and if using the tdistribution round your answer to three decimal places.) =l:l _ What is the p-value? (Round your answer to four decimal places.) :] Explain what the p-value means for this problem. O If Ho is false, then there is a chance equal to the p-value that the sample average difference between the post-course scores and pre-course scores is at least 35.83. If Ho is false, then there is a chance equal to the p-value that the sample average difference between the post-course scores and pre-course scores is less than 35.83. If Ho is true, then there is a chance equal to the p-value that the sample average difference between the post-course scores and pre-course scores is less than 35.83. O If Ho is true, then there is a chance equal to the p-value that the sample average difference between the post-course scores and pre-course scores is at least 35.83. Part (g) Sketch a picture of this situation. Label and scale the horizontal axis and shade the region(s) corresponding to the p-value. p-value p-value Xd Xd O 0 O 0 1/2(p-value) 1/2(p-value; 1/2(p-value) 1/2(p-value; Xd Xd O 0 O 0E] Part (h) Indicate the correct decision ("rejec " or "do not reject" the null hypothesis), the reason for it, and write an appropriate conclusion. (i) Alpha (Enter an exact number as an integer, fraction, or decimal.) (ii) Decision: 0 reject the null hypothesis 0 do not reject the null hypothesis (iii) Reason for decision: 0 Since p-value a, we reject the null hypothesis. 0 Since p-value > a, we do not reject the null hypothesis. 0 Since p-value