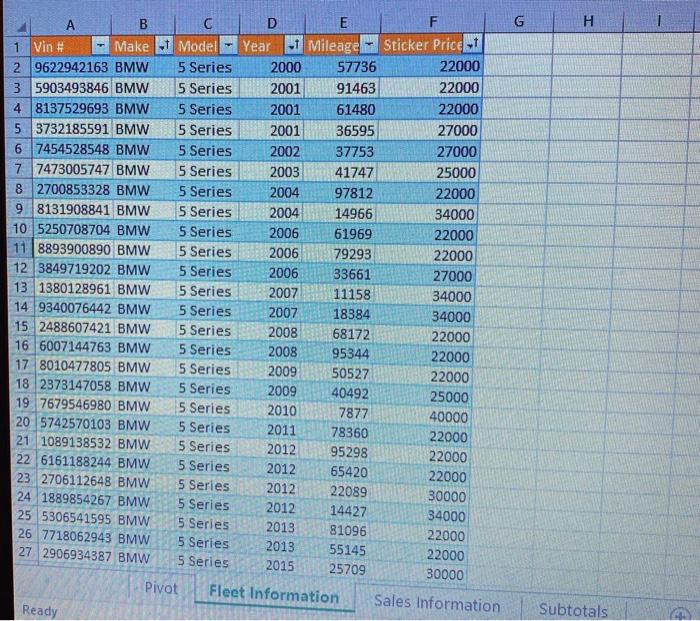
Question: please help with qusestions 10, 11, 12 H D E F B G 1 Vin # Make Model Year 1 Mileage Sticker Price -1 2

please help with qusestions 10, 11, 12
please help with qusestions 10, 11, 12 H D E F B
H D E F B G 1 Vin # Make Model Year 1 Mileage Sticker Price -1 2 9622942163 BMW 5 Series 2000 57736 22000 3 5903493846 BMW 5 Series 2001 91463 22000 4 8137529693 BMW 5 Series 2001 61480 22000 5 3732185591 BMW 5 Series 2001 36595 27000 6 7454528548 BMW 5 Series 2002 37753 27000 7 7473005747 BMW 5 Series 2003 41747 25000 8 2700853328 BMW 5 Series 2004 97812 22000 9 8131908841 BMW 5 Series 2004 14966 34000 10 5250708704 BMW 5 Series 2006 61969 22000 11 8893900890 BMW 5 Series 2006 79293 22000 12 3849719202 BMW 5 Series 2006 33661 27000 13 1380128961 BMW 5 Series 2007 11158 34000 14 9340076442 BMW 5 Series 2007 18384 34000 15 2488607421 BMW 5 Series 2008 68172 22000 16 6007144763 BMW 5 Series 2008 95344 22000 17 8010477805 BMW 5 Series 2009 50527 22000 18 2373147058 BMW 5 Series 2009 40492 25000 19 7679546980 BMW 5 Series 2010 7877 40000 20 5742570103 BMW 5 Series 2011 78360 22000 21 1089138532 BMW 5 Series 2012 95298 22000 22 6161188244 BMW 5 Series 2012 65420 22000 23 2706112648 BMW 5 Series 2012 22089 30000 24 1889854267 BMW 5 Series 2012 14427 25 5306541595 BMW 34000 5 Series 2013 81096 26 7718062943 BMW 22000 5 Series 2013 55145 27 2906934387 BMW 22000 5 Series 2015 25709 30000 Pivot Fleet Information Sales Information Ready Subtotals C D G H K B E F 27 2906934387 BMW 5 Series 2015 25709 30000 28 5718003239 BMW 5 Series 2016 39202 27000 29 4094989639 BMW 5 Series 2017 92048 22000 30 8019012354 BMW 5 Series 2017 50120 22000 31 4700777743 BMW 5 Series 2017 44667 25000 32 8000086254 BMW 5 Series 2017 28681 30000 33 7397531553 BMW 5 Series 2018 36000 27000 34 1328395941 Chevy Malibu 2002 48868 25000 35 1563229851 Chevy Malibu 2002 13764 34000 36 4913951544 Chevy Malibu 2003 40380 25000 37 1360867906 Chewy Malibu 2004 70797 22000 38 1409363873 Chevy Malibu 2004 80047 22000 39 7433901231 Chevy Malibu 2010 37085 27000 40 7541058788 Chevy Malibu 2011 77099 22000 41 8281760371 Chevy Malibu 2012 44985 25000 42 8054683334 Chevy Malibu 2012 36934 27000 43 2747847524 Chevy Malibu 2014 50650 22000 44 7092958553 Chevy Malibu 2014 11654 34000 45 3814357405 Chevy Malibu 2016 54060 22000 46 6729292004 Ford F-150 2001 63166 22000 47 9027521957 Ford F-150 2002 90009 22000 48 7596630806 Ford F-150 2003 81699 22000 49 8163497575 Ford F-150 2004 91310 22000 50 9885757629 Ford F-150 2004 19686 34000 51 4942016124 Ford F-150 2006 63737 22000 52 345743062 Ford F-150 2007 31562 27000 53 4174658862 Ford F-150 2009 54406 22000 Pivot Fleet Information Sales Information Subtotals G D E 51 4942016124 Ford F-150 2006 63737 22000 52 3345243052 Ford F-150 2007 31562 27000 53 4174658862 Ford F.350 2009 54406 22000 54 3860818150 Ford F-150 2009 14095 34000 55.1218797573 Ford F-150 2010 11098 34000 56 8251440185 Ford F-150 2011 76254 22000 575322014014 Ford F-150 2011 46216 25000 58 9305933928 Ford F-150 2011 40807 25000 595463769134 Ford F150 2012 99161 22000 60 9650039042 Ford F-150 2012 28541 30000 1612482451414 Ford F-150 2014 83281 22000 621 3695501103 Ford F:150 2015 99021 22000 685726149503 Ford F-150 2015 6971 40000 546556316751 Ford F-150 2016 58076 22000 657377188604 Ford F-150 2016 52774 22000 66 8357455137 Ford F-150 2016 17398 34000 67 4820173885 Ford F-150 2016 6921 40000 68 5095450285 Ford F-150 2018 70078 22000 69 9886768452 Ford F-150 2019 65124 44000 705293323010 Honda Civic 2001 30840 27000 71/3867060584 Honda Civic 2003 52586 22000 72 6891374035 Honda Civic 2003 75313 22000 73 3578026701 Honda Civic 2003 34825 27000 74 8279091856 Honda Civic 2003 4129 40000 75 7200319445 Honda Civic 2005 23147 30000 76 8156049535 Honda Civic 2005 3997 40000 776287671745 Honda Civic 2007 49295 25000 78 4730270262 Honda Civic 2007 8541 40000 79. 6290615001 Honda Civic 2009 96345 22000 80 3133070112 Honda Civic 2009 46323 25000 81 2406189439 Honda CIVIC 2010 49544 25000 82 8806645278 Honda Civic 2012 76217 22000 83 5739567111 Honda Civic 2013 99041 22000 84 5161605236 Honda Civic 2013 31271 27000 85 2069016783 Honda Civic 2014 34428 27000 86 8725850239 Honda Civic 2016 57432 22000 871531278978 Honda Civic 2018 82011 22000 88 5276867505 Honda Civic 2018 39645 27000 89 6993487147 Honda Civic 2018 26609 30000 90 1532392596 Honda Civic 2018 3308 40000 91 1213463078 Toyota Prius 2000 93430 22000 92 9356019403 Toyota Prius 2000 96905 22000 93 6015917869 Toyota Prius 2001 B7698 22000 94 3737821324 Toyota Prius 2001 35426 27000 95 2976194513 Toyota Prius 2003 27493 96 1344751603 Toyota 30000 Prius 2004 42890 79414505 Toyota 25000 Prius 2004 2130 300M Pivot Fleet Information Sales Information Subtotals Ready 380 72 6891374035 Honda Civic 2003 75313 22000 73 3578026701 Honda Civic 2003 34825 27000 74 8279091856 Honda Civic 2003 4129 40000 75 7200319445 Honda Civic 2005 23147 30000 76 8156049535 Honda Civic 2005 B997 40000 776287671745 Honda Civic 2007 49295 25000 78 4730270762 Honda Civic 2007 8541 40000 79 6290615001 Honda Civic 2009 96345 22000 80 3139070112 Honda Civic 2009 46323 25000 81 2406189439 Honda Civic 2010 49544 25000 82 8806645278 Honda Civic 2012 76217 22000 83 5739567111 Honda Civic 2013 99041 22000 84 5161605236 Honda Civic 2013 31271 27000 85 2069016783 Honda Civic 2014 34428 27000 86 8725850239 Honda Civic 2016 57432 22000 87 1531278978 Honda Civic 2018 82011 22000 88 5276867505 Honda Civic 2018 39645 27000 896393487147 Honda Civic 2018 26609 30000 90 1532392596 Honda Civic 2018 3308 40000 91 1213463078 Toyota Prius 2000 93430 22000 92 9356019403 Toyota Prius 2000 96905 22000 193 6015917869 Toyota Prius 2001 87698 22000 94 3737821324 Toyota Prius 2001 35426 27000 95 2976194513 Toyota Prius 2003 27493 30000 96 1344751603 Toyota Prius 2004 42890 25000 97 9414505869 Toyota Prius 2004 21380 30000 198 1462643171 Toyota Prius 2006 8887 40000 99 9537026620 Toyota Prius 2008 27785 30000 100 4370047837 Toyota Prius 2012 38800 27000 101 6851036813 Toyota Prius 2013 79226 22000 102 5122993766 Toyota Prius 2014 84930 22000 103 9957511962 Toyota Prius 2017 27785 23000 104 Total 2714000 105 106 107 108 109 110 111 112 11 114 115 Pivot Fleet Information Sales Ini 97 10. Your boss wants to know how much inventory value there is for each make of car. Use the sticker price from the Fleet Information worksheet. Create a pivot table to provide this information. Put the pivot table in a worksheet named Pivot (10 pts) 11. Create another pivot table that contains the average price of each make of car. Place this pivot table in the Pivot worksheet. (10 pts) 12. Using the Fleet Information worksheet create a table using functions to validate the results in steps 10 and 11. Put this table somewhere in the range H1-M15. Properly label the title rows and columns. Suggested functions might include sumif, sumifs, averageif and averageifs: (15 pts)

Step by Step Solution

There are 3 Steps involved in it

1 Expert Approved Answer
Step: 1 Unlock blur-text-image
Question Has Been Solved by an Expert!

Get step-by-step solutions from verified subject matter experts

Step: 2 Unlock
Step: 3 Unlock

Students Have Also Explored These Related General Management Questions!