Question: Please solve the following question using excel commands like solver, Analytic Solver, or sensitivity analysis. 5. Reconsider the model given in Problem 5.2. While doing
Please solve the following question using excel commands like solver, Analytic Solver, or sensitivity analysis.
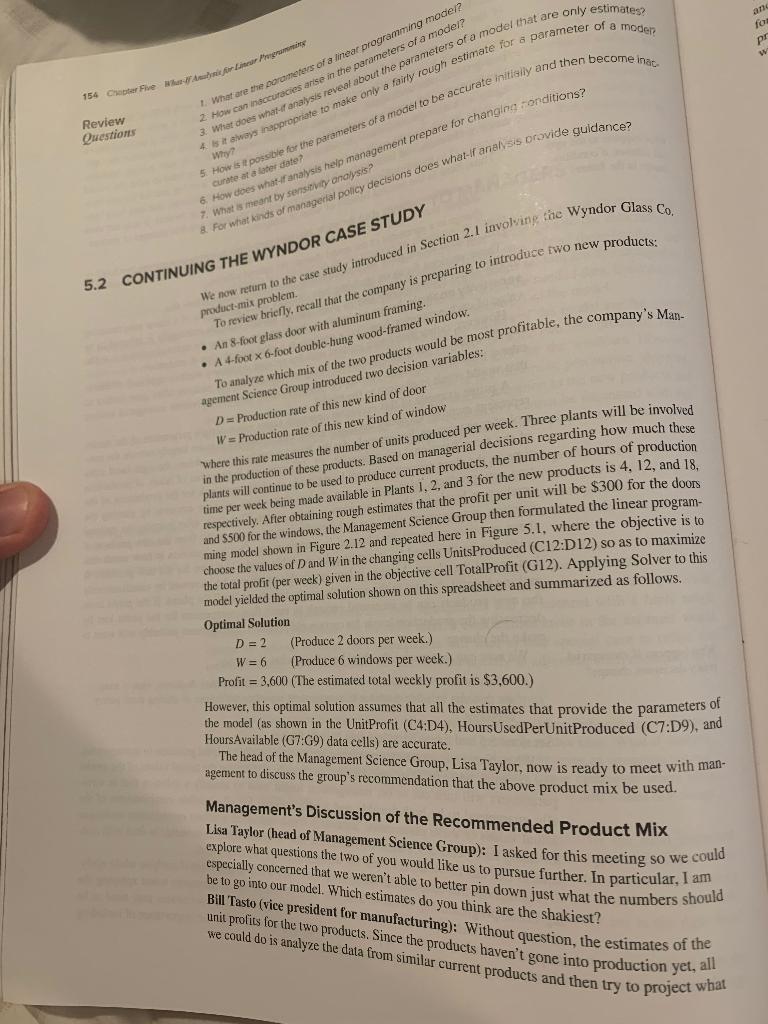
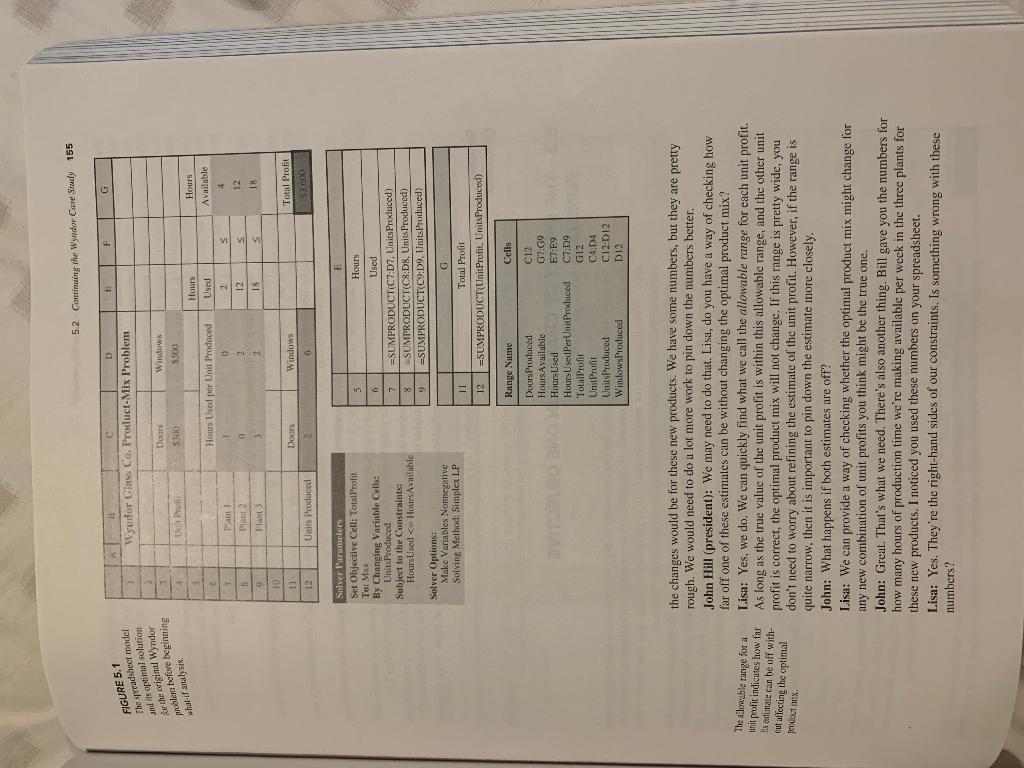
5. Reconsider the model given in Problem 5.2. While doing what-if analysis, you learn that the estimates of the right-hand sides of the two functional constraints are accurate only to within + 50 percent. In other words, the ranges of likely values for these parameters are 5 to 15 for the first right-hand side and 6 to 18 for the second right-hand side. a. After solving the original spreadsheet model, determine the shadow price for the first functional constraint by increasing its right-hand side by one and solving again. b. Use a parameter analysis report to generate the optimal solution and total profit as the right-hand side of the first functional constraint is incremented by 1 from 5 to 15. Use this table to estimate the allowable range for this right-hand side, that is, the range over which the shadow price obtained in part a is valid. c. Repeat part a for the second functional constraint. d. Repeat part b for the second functional constraint where its right- hand side is incremented by 1 from 6 to 18. e. Use Solver's sensitivity report to determine the shadow price for each functional constraint and the allowable range for the right-hand side of each of these constraints. fo P 154 ChatterFive for Review Questions What are the parameters of a rear programming model 2 How can inccuracies arise in the parameters of a model? 3. What does what if analysis reveal about the parameters of a model that are only estimates 4 always inapropriate to make only a fairly Tough estimate for a parameter of a moder 5. How is it possible for the parameters of a model to be accurate initially and then become inat How does what if analysis help management prepare for changing-onditions? Why? curate ata stater date? 7. What is meant by sensitivity analysis? & For what kinds of managerial policy decisions does what-ir analysis provide guidance? 5.2 CONTINUING THE WYNDOR CASE STUDY We now return to the case study introduced in Section 2.1 involving the Wyndor Glass Co. To review briefly recall that the company is preparing to introduce two new products: product-mix problem An 8-foot glass door with aluminum framing. A 4-foot X 6-foot double-hung wood-framed window. To analyze which mix of the two products would be most profitable, the company's Man- agement Science Group introduced two decision variables: D = Production rate of this new kind of door W = Production rate of this new kind of window where this rate measures the number of units produced per week. Three plants will be involved in the production of these products. Based on managerial decisions regarding how much these plants will continue to be used to produce current products, the number of hours of production time per week being made available in Plants 1, 2 and 3 for the new products is 4. 12, and 18. respectively. After obtaining rough estimates that the profit per unit will be $300 for the doors and S500 for the windows, the Management Science Group then formulated the linear program- ming model shown in Figure 2.12 and repeated here in Figure 5.1, where the objective is to choose the values of Dand Win the changing cells Units Produced (C12:D12) so as to maximize the total prolt (per week) given in the objective cell TotalProfit (G12). Applying Solver to this model yielded the optimal solution shown on this spreadsheet and summarized as follows. Optimal Solution D = 2 W = 6 (Produce 2 doors per week.) (Produce 6 windows per week.) Profit = 3,600 (The estimated total weekly profit is $3,600.) However, this optimal solution assumes that all the estimates that provide the parameters of the model (as shown in the UnitProfit (C4:04), Hours UsedPerUnitProduced (C7:09), and HoursAvailable (G7:49) data cells) are accurate, The head of the Management Science Group, Lisa Taylor, now is ready to meet with man- agement to discuss the group's recommendation that the above product mix be used. Management's Discussion of the Recommended Product Mix Lisa Taylor (head of Management Science Group): I asked for this meeting so we could explore what questions the two of you would like us to pursue further. In particular, I am especially concerned that we weren't able to better pin down just what the numbers should be to go into our model. Which estimates do you think are the shakiest? Bil Tasto (vice president for manufacturing): Without question, the estimates of the unit profits for the two products. Since the products haven't gone into production yet, all We could do is analyze the data from similar current products and then try to project what 5.2 Continuing the Wyndor Case Study 155 E F G Wudor Class Co. Product-Mix Problem FIGURE 5.1 The spreadsheet model mas optimal solution for the original Wyndor problem before beginning what-il analysis Daun 5300 Windows $500 U Pro Hours Used per Unit Produced Hours Used 2 12 18 Hours Available 4 Pant Plant 2 Plant 2 s S 12 18 TO Totul Profit Doors Windows 6 12 Units Produced F 5 Solver l'uranieters Set Objective Cell: "TotalProfit Tor Max By Changing Variable Cells: Units Produced Subject to the Constraints: Hours UsedHours Available 6 Hours Used =SUMPRODUCT(C7:07, Units Proxluced) SUMPRODUCT C8D8, Units Produced) =SUMPRODUCT(C9:09. Units Produced) Solver Options: Make Vanables Nonnegative Solving Method: Simplex LP G 11 Total Profit 12=SUMPRODUCT(UnitProfit. Units Produced) Ceils Range Name Doors Produced Hours Available Hours Used Hours UsedPermit Produced Total Profit UnitProfit Units Produced Windows Produced C12 G7:09 E7:E9 C%D9 G12 C4.14 C12:012 D12 The allowable range for a una profit indicates how far sestunate can be off with- cut affecting the optimal porect the changes would be for these new products. We have some numbers, but they are pretty rough. We would need to do a lot more work to pin down the numbers better. John Hill (president): We may need to do that. Lisa, do you have a way of checking how far off one of these estimates can be without changing the optimal product mix? Lisa: Yes, we do. We can quickly find what we call the allowable range for each unit profit. As long as the true value of the unit profit is within this allowable range, and the other unit profit is correct, the optimal product mix will not change. If this range is pretty wide, you don't need to worry about refining the estimate of the unit profit. However, if the range is quite narrow, then it is important to pin down the estimate more closely. John: What happens if both estimates are off? Lisa: We can provide a way of checking whether the optimal product mix might change for any new combination of unit profits you think might be the true one. John: Great. That's what we need. There's also another thing. Bill gave you the numbers for how many hours of production time we're making available per week in the three plants for these new products. I noticed you used these numbers on your spreadsheet. Lisa: Yes. They're the right-hand sides of our constraints. Is something wrong with these numbers? 156 Chapter Ave w/w w Linear Promine the new products for each additional hour of production time per weck we provide in one of John: No, but we would like your group to provide us with somentalysis of what the effect would be if we change any one of those numbers. How much more profit could we get from the plants? That sort of thing, Lisa: Yes, we can get that analysis to you right away also. John: We might also be interested in changing the available production hours for two or three of the plants. Other key numbers that can only be estimated are the production rates of the doors and windows in plant 3. What happens if those estimates are uncertain? Lisa: No problem. We'll give you information about all of that as well. Summary of Management's What If Questions Here is a summary of John Hill's what-if questions that Lisa and her group will be addressing in the coming sections. 1. What happens if the estimate of the unit profit of one of Wyndor's new products is inac curate? (Section 5.3) 2. What happens if the estimates of the unit profits of both of Wyndor's new products are inaccurate? (Section 5.4) 3. What happens if a change is made in the number of hours of production time per week being made available to Wyndor's new products in one of the plants? (Section 5.5) 4. What happens if simultaneous changes are made in the number of hours of production time per week being made available to Wyndor's new products in all the plants? (Section 5.6) 5. What happens if the production rates of doors and windows at plant 3 are uncertain? (Sections 5.7 and 5.8) Review Questions 1. Which estimates of the parameters in the linear programming model for the Wyndor problem are most questionable? 2. Which numbers in this model represent tentative managerial decisions that management might want to change after receiving the Management Science Group's analysis? 5.3 THE EFFECT OF CHANGES IN ONE OBJECTIVE FUNCTION COEFFICIENT Section 5.1 began by discussing the fact that many of the parameters of a linear programming model typically are only estimates of quantities that cannot be determined precisely at the time. What-if analysis for sensitivity analysis in particular) reveals how close each of these estimates needs to be to avoid obtaining an erroneous optimal solution. We focus in this section on how sensitivity analysis does this when the parameters involved are coefficients in the objective function. (Recall that each of these coefficients gives the unit contribu- tion of one of the activities toward the overall measure of performance.) In the process, we will address the first of the what-if questions posed by Wyndor management in the preceding section. Question 1: What happens if the estimate of the unit profit of one of Wyndir inaccurate? To start this process, first consider th for the unit profit for Wynd Po


