

Question: Please help with the sums 2 x (1 point) The rectangles in the graph below illustrate a left endpoint Riemann sum for f(x) = g
Please help with the sums
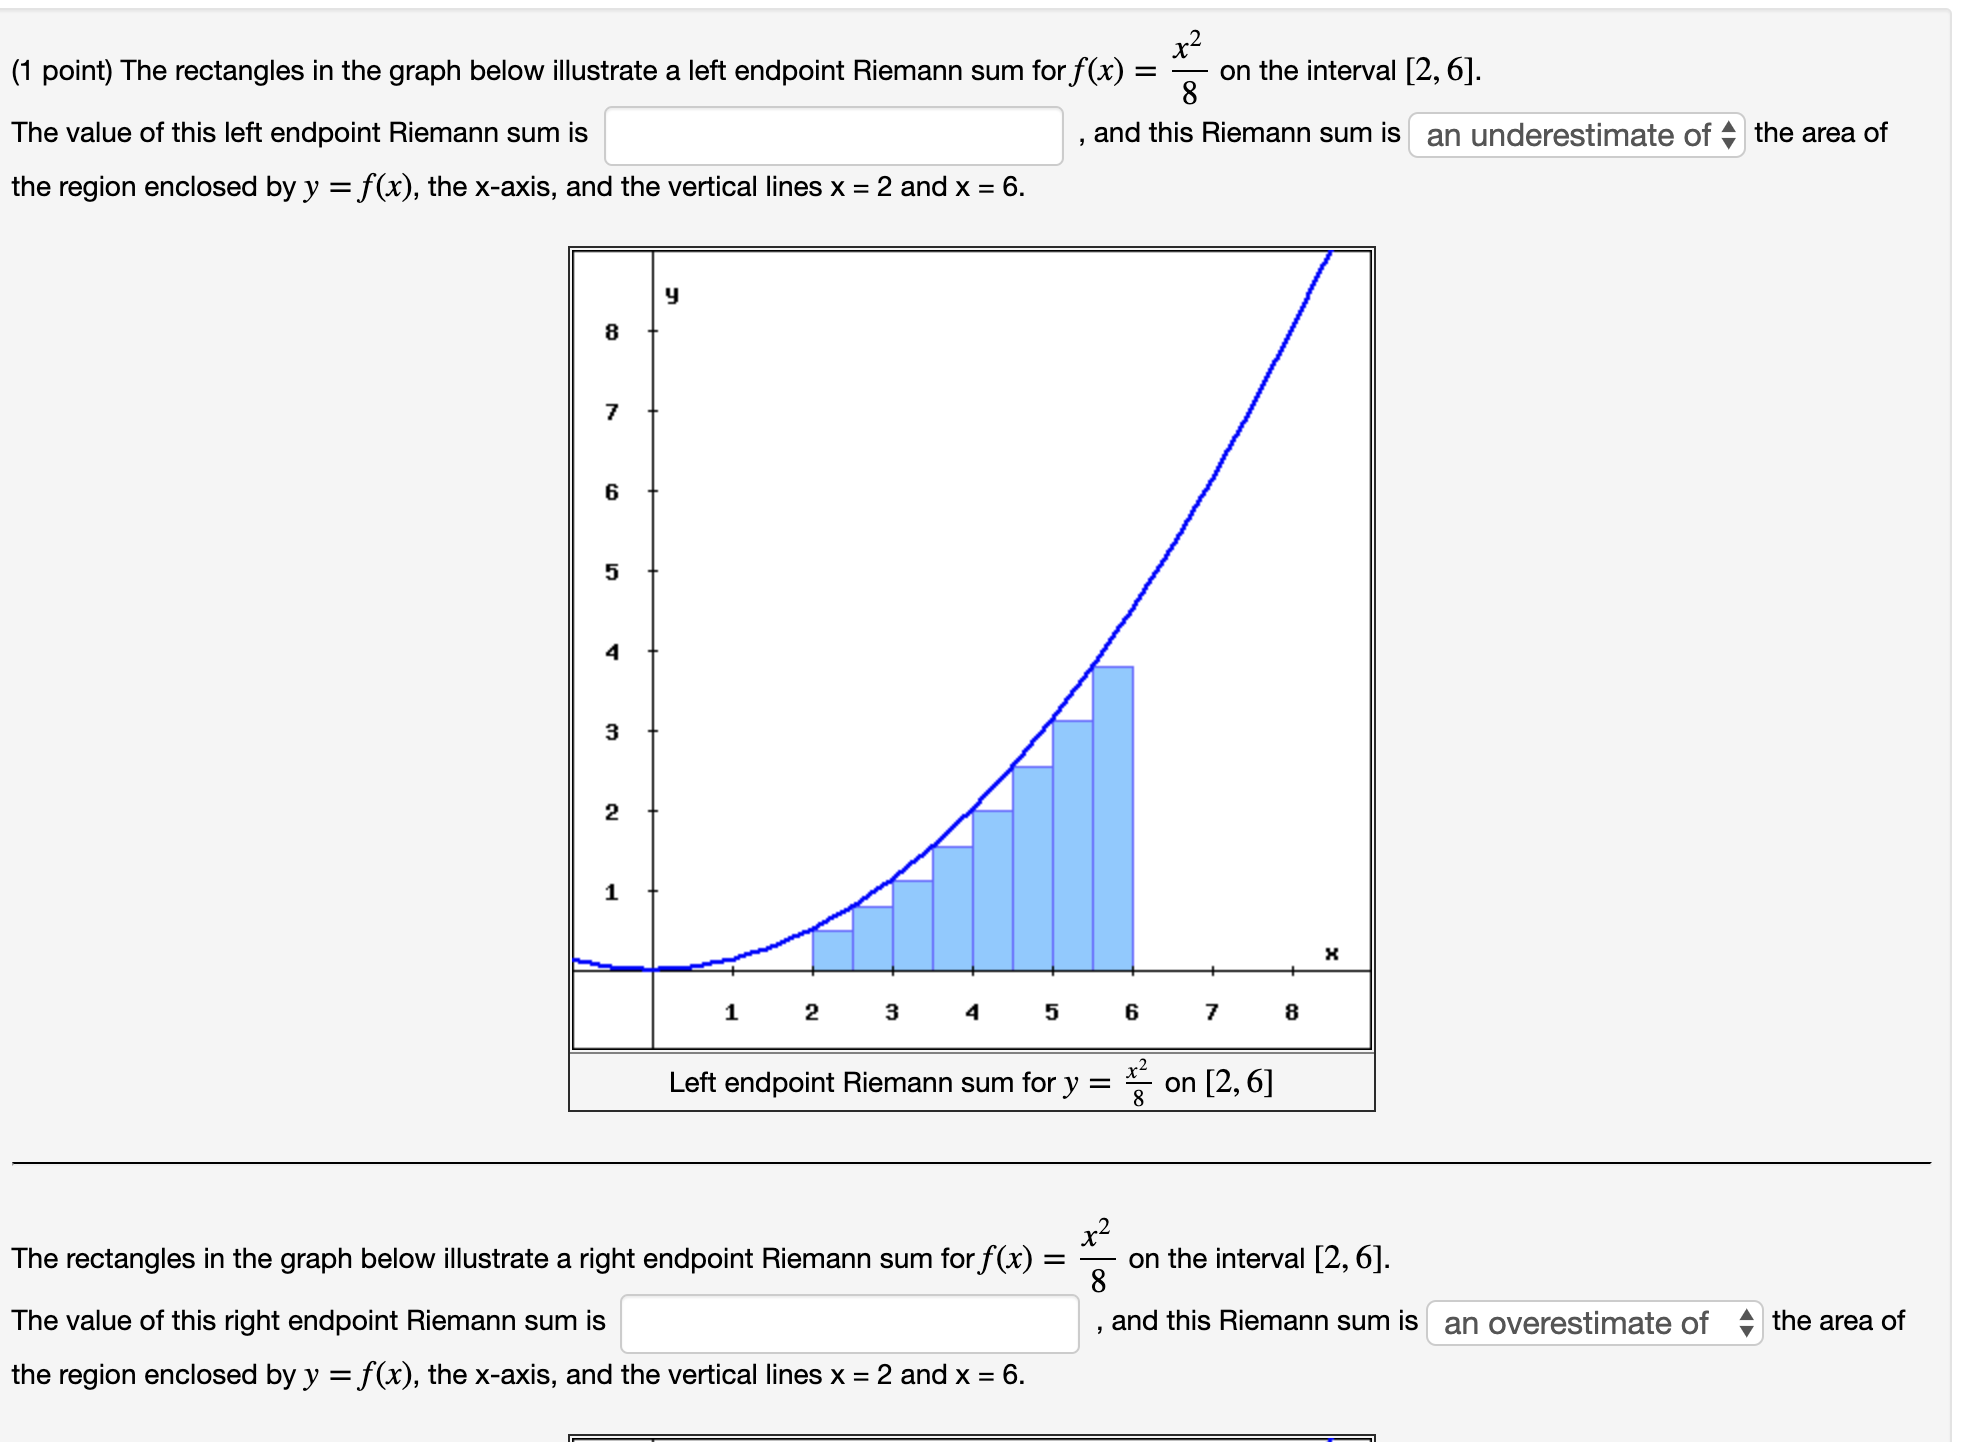
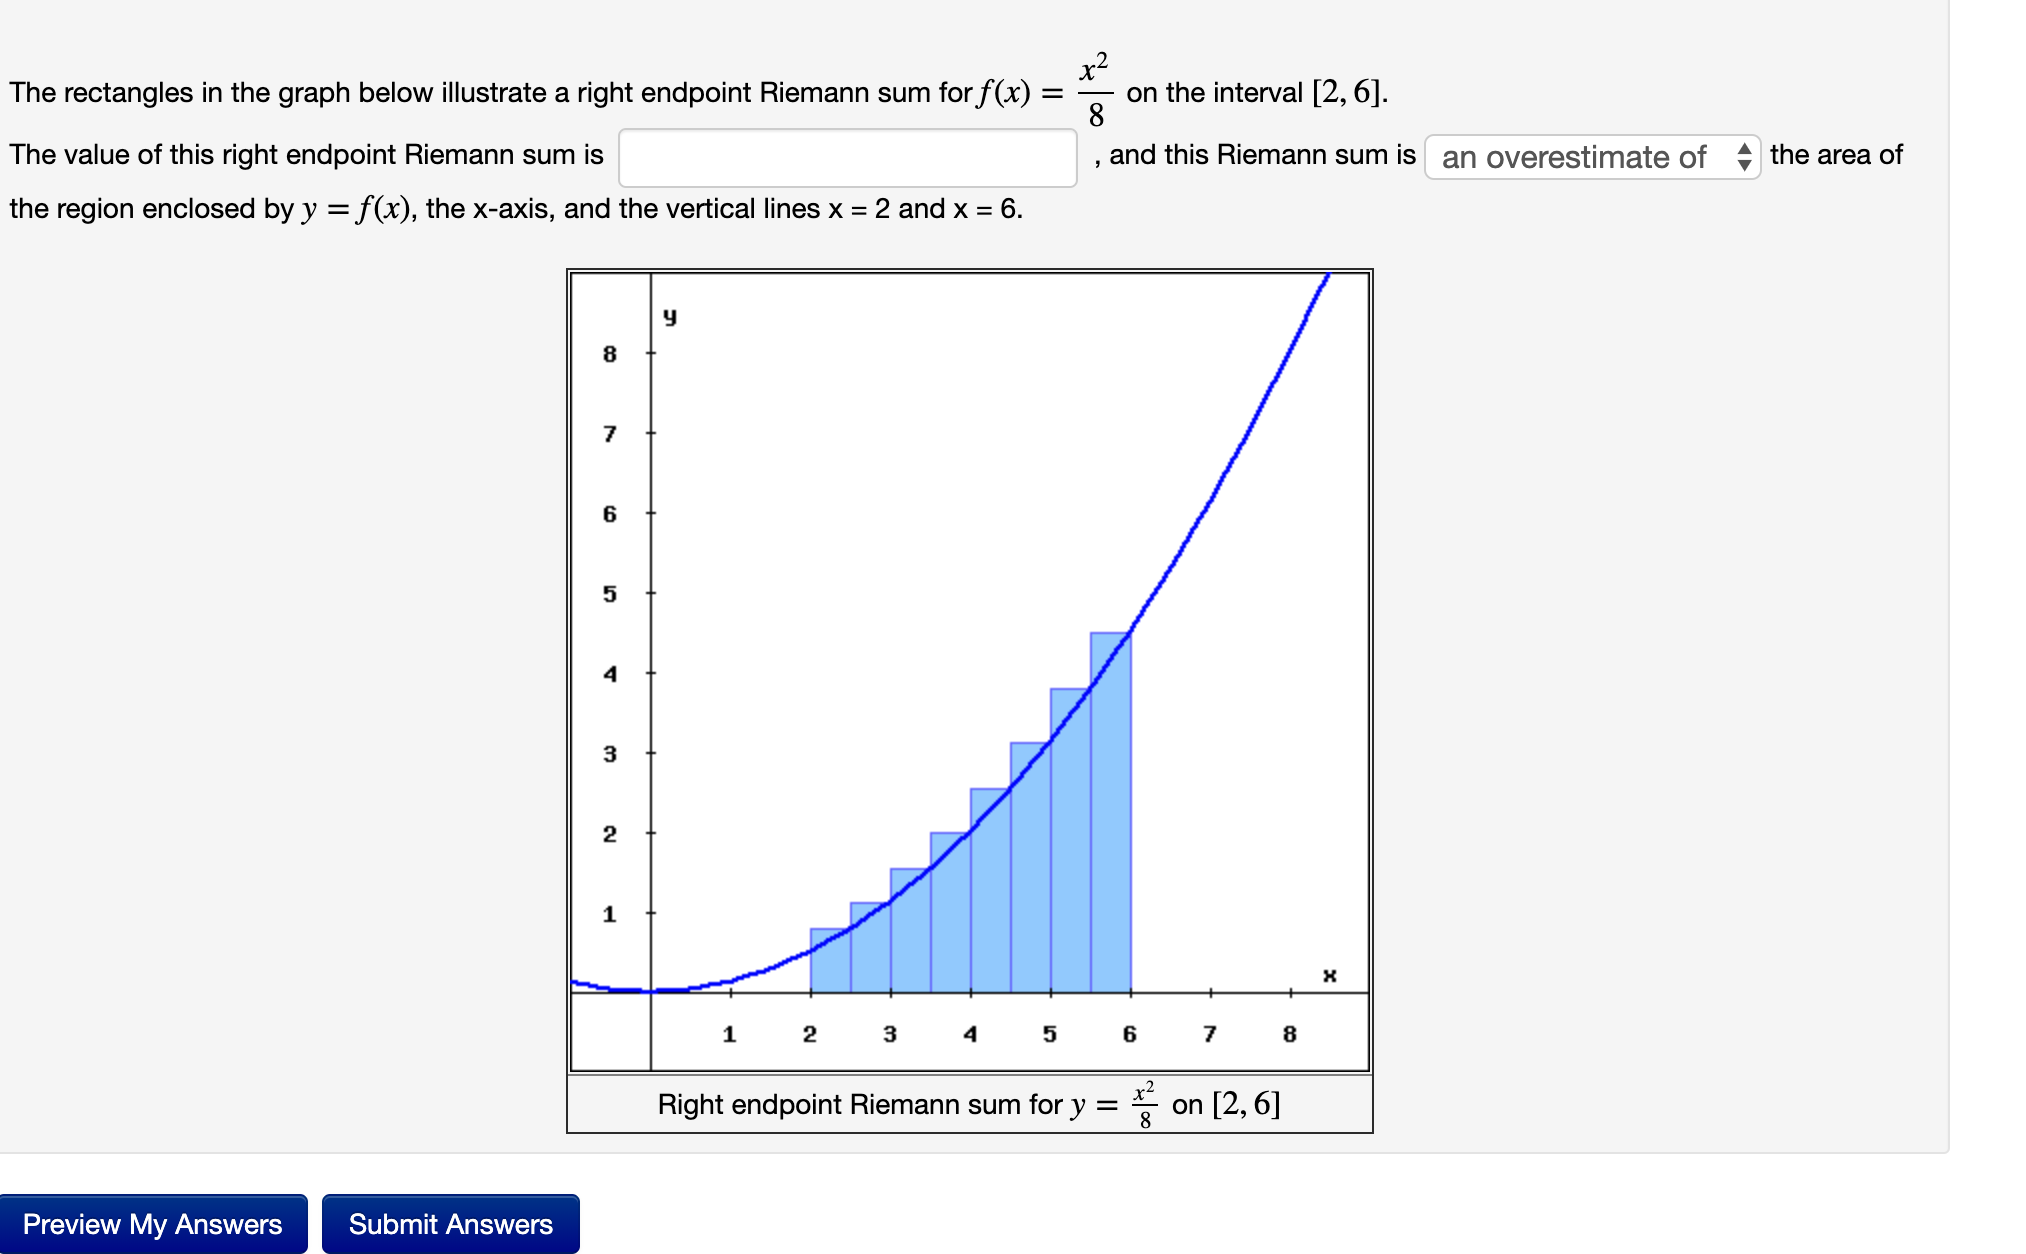
2 x (1 point) The rectangles in the graph below illustrate a left endpoint Riemann sum for f(x) = g on the interval [2, 6]. The value of this left endpoint Riemann sum is , and this Riemann sum is an underestimate of 3 the area of the region enclosed by y = f(x), the x-axis, and the vertical lines x = 2 and x = 6. 2 Left endpoint Riemann sum for y = x? on [2, 6] 2 x The rectangles in the graph below illustrate a right endpoint Riemann sum for f (x) = g on the interval [2, 6]. , and this Riemann sum is an overestimate of c the area of The value of this right endpoint Riemann sum is the region enclosed by y = f(x). the x-axis, and the vertical lines x = 2 and x = 6. 2 x The rectangles in the graph below illustrate a right endpoint Riemann sum for f(x) = g on the interval [2, 6]. The value of this right endpoint Riemann sum is , and this Riemann sum is an overestimate of $ the area of the region enclosed by y = f(x). the x-axis, and the vertical lines x = 2 and x = 6. Right endpoint Riemann sum for y = g on [2,6] Preview My Answers Submit Answers
Step by Step Solution
There are 3 Steps involved in it

Get step-by-step solutions from verified subject matter experts