

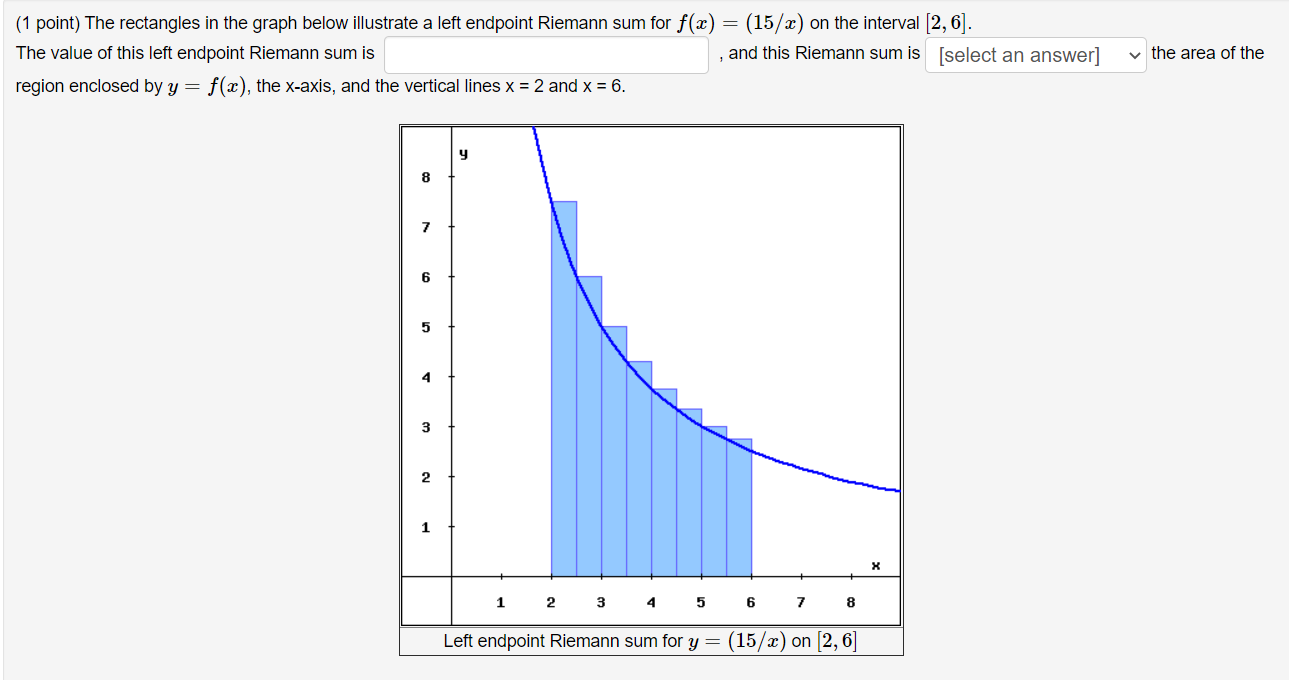
Question: (1 point) The rectangles in the graph below illustrate a left endpoint Riemann sum for x) 2 (15/2) on the interval [2, 6]. , and
![endpoint Riemann sum for x) 2 (15/2) on the interval [2, 6].](https://dsd5zvtm8ll6.cloudfront.net/si.experts.images/questions/2024/11/6730bcb4674d6_2836730bcb414eae.jpg)
(1 point) The rectangles in the graph below illustrate a left endpoint Riemann sum for x) 2 (15/2) on the interval [2, 6]. , and this Riemann sum is [select an answer] v the area of the The value of this left endpoint Riemann sum is region enclosed by y : x), the x-axis, and the vertical lines x = 2 and x = 6. Left endpoint Riemann sum for y : (15/2) on [2, 6] The rectangles in the graph below illustrate a right endpoint Riemann sum for x) 2 (15/2) on the interval [2, 6]. The value of this right endpoint Riemann sum is l , and this Riemann sum is [select an answer] v the area of the region enclosed by y : x), the x-axis, and the vertical lines x = 2 and x = 6. 1 2 3 4 5 E i" B Right endpoint Riemann sum for y = (15/1,) on [2, 6]
Step by Step Solution
There are 3 Steps involved in it

Get step-by-step solutions from verified subject matter experts