

Question: Please help with this homework question! Refer to Table 90.1 Fastes.for Computing Control Chart Limits..sigma) for this problem Twelve samples, each containing five parts were
Please help with this homework question! 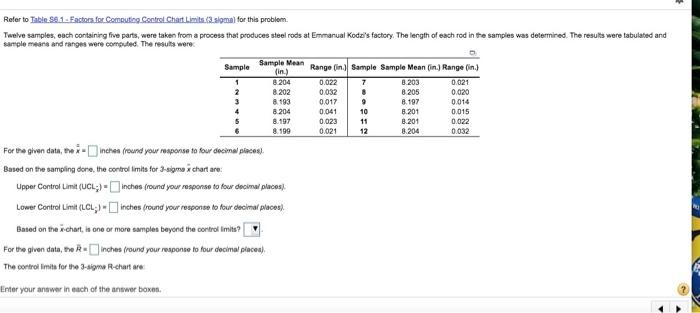
Refer to Table 90.1 Fastes.for Computing Control Chart Limits..sigma) for this problem Twelve samples, each containing five parts were taken from a process that produces steel rods at Emmanual Koda's factory. The length of each rod in the samples was determined. The results were tabulated and sample means and ranges were computed. The results were Sample Sample Mean 0032 1 2 3 4 5 8204 8.202 8193 8204 8.197 8. 190 Range (in.) Sample Sample Mean (in.) Range (in.) 0.022 7 8.203 0.021 . 8205 0.020 0.017 9 8.197 0.014 0.041 10 8201 0.015 11 B.201 0.022 0.021 12 8.204 0.032 0023 For the given dat, i- inches (round your response to four decima place) Based on the sampling done, the control limits for 3-simo chat are Upper Control Limit (UCL;) - inches (round your response to four decimal places) Lower Control Limit (LCL;) - inches fround your response to four decimal places. Based on the chart, is one or more samples beyond the controllimis? For the given data, the Rinches (round your response to four decimal placea) The controllimits for the 3-dime-chart are Enter your answer in each of the answer boxe
Step by Step Solution
There are 3 Steps involved in it
1 Expert Approved Answer
Step: 1 Unlock

Question Has Been Solved by an Expert!
Get step-by-step solutions from verified subject matter experts
Step: 2 Unlock
Step: 3 Unlock