

Question: PLEASE HELP!!! Write a script to perform interpolation for the data given in Table 2. After defining the x and y data points, generate a
PLEASE HELP!!!
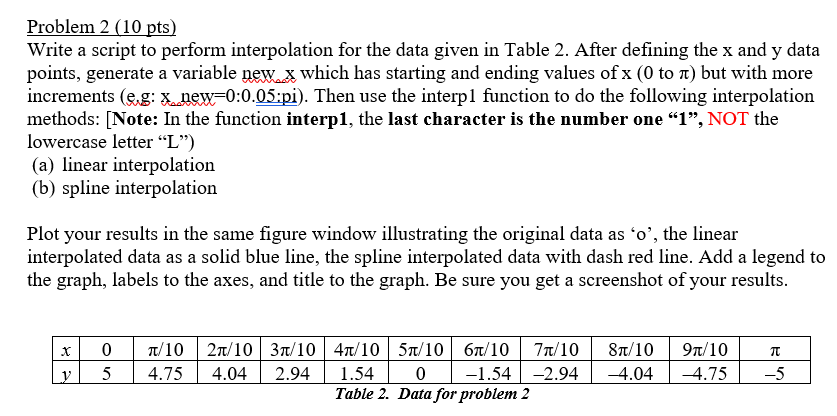
Write a script to perform interpolation for the data given in Table 2. After defining the x and y data points, generate a variable new_x which has starting and ending values of x (0 to pi) but with more increments (e.g: x_new = 0:0.05:pi). Then use the interp 1 function to do the following interpolation methods: (a) linear interpolation (b) spline interpolation Plot your results in the same figure window illustrating the original data as 'o', the linear interpolated data as a solid blue line, the spline interpolated data with dash red line. Add a legend to the graph, labels to the axes, and title to the graph. Be sure you get a screenshot of your results
Step by Step Solution
There are 3 Steps involved in it

Get step-by-step solutions from verified subject matter experts