Question: please highlight each asnwer please - X Definition TIS [ Mean Factor, n chart Lower Range, D 0 spons Sample Size, n 2 3 4

please highlight each asnwer please please highlight each asnwer please - X
please highlight each asnwer please - X
- X Definition TIS [ Mean Factor, n chart Lower Range, D 0 spons Sample Size, n 2 3 4 5 6 7 sponse Upper Range, D 3.268 2.574 2.282 2.115 2.004 1.924 1.864 1.816 1.777 1.716 1.880 1.023 0.729 0.577 0.483 0.419 0.373 0.337 0.308 0.266 espons 0 0 0.076 0.136 0.184 0.223 0.284 espons 10 12 amples aples bo Refer to Table S51 - Factors for Computing Control Chart Limis (3 sioma) for this problem A process that is considered to be in control measures an ingredient in ounces. Below are the last 10 samples (each of size 5) takan. The population process standard deviation is 164 Samples 2 3 9 10 1 10 9 9 10 11 9 9 12 10 9 12 10 10 10 8 4 9 11 11 9 11 5 11 9 10 11 9 11 9 7 12 8 7 10 12 11 7 10 B 12 18 8 9 7 7 7 13 12 10 10 11 10 12 - Standard deviation of the samping means = ounces (round your response to the decimal plucot b) With 2 = 3, the control limits for the mean chart are: UCL-ounces round your response to the dooma piacos LCL-ounces (round your response to the decimal pieces) c) The controlimits for the R-charta UCLA -Ounces (round your response to three decimal places LCLROunces (round your response to three decimal places d) Based on the chart is one or more samples beyond the control imta? Based on the R-chart, is one or more samples beyond the controllimis

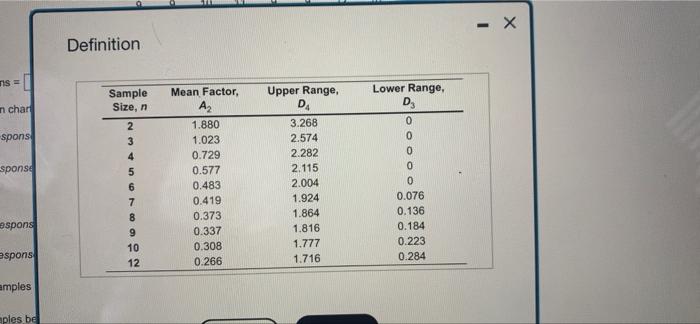
Step by Step Solution

There are 3 Steps involved in it

1 Expert Approved Answer
Step: 1 Unlock blur-text-image
Question Has Been Solved by an Expert!

Get step-by-step solutions from verified subject matter experts

Step: 2 Unlock
Step: 3 Unlock

Students Have Also Explored These Related General Management Questions!