

Question: Please I need help desperately for this question. 1) Provide Histograms in your Appendix that demonstrates the distribution of the PSY391 cohort on all 5

Please I need help desperately for this question. 1) Provide Histograms in your Appendix that demonstrates the distribution of the PSY391 cohort on all 5 domains, and where your score sits on the distribution for each domain.
Excel Sheet: https://docs.google.com/spreadsheets/d/1DQNLeVDA_zmiodFCaQHwpc4WKOjSvf6v/edit?usp=sharing&ouid=118018713131566068730&rtpof=true&sd=true Relevant Information for making the Histograms: Outline: Based on your results from completing the 120-item IPIP (Maples, Guan, Carter, & Miller, 2014) representative of the NEO-PI-R domains of personality, this research asks you to make a review of your results and their potential implications based on findings from published literature.

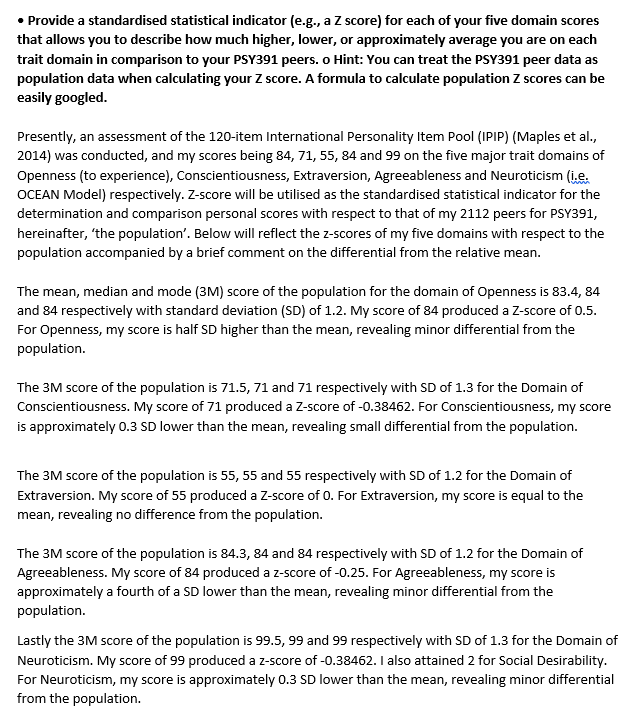
I Provide a standardised statistical indicator [e.g., a 2 score] for each of your five domain scores that allows you to describe how much higher, lower, or approximately average you are on ea ch trait domain in comparison to your P5Y391 peers. o Hint: You can treat the PS'I'391 peer data as population data when calculating your I score. A formula to calculate population 2 scores can be easily googled. Presently, an assessment of the 12Ditem International Personality Item Pool {IPIF'} {Maples et al., 2014] was conducted, and my scores being E4, 21, 55, 3.4 and 55 on the ve major trait domains of Openness {to experience], IConscientiousness, Extraversion, agreeableness and Neuroticism ll; DCEAN Model] respectively. 2score will be utilised as the standardised statistical indicator for the determination and comparison personal scores with respect to that of my 2112 peers for P3391, hereinafter, 'the population'. Below will reflect the ascores of my ve domains with respect to the population accompanied by a brief comment on the differential from the relative mean. The mean, median and mode [3M] score of the population forthe domain of Openness is 83.4, Bal- and 34 respectively with standard deviation [SD] of 1.2. My score of 84 produced a Z-score of I15. For Dpenness, my score is half SD higher than the mean, revealing minor differential from the population. The 3M score of the population is 11.5, T1 and 21 respectively with SD of 1.3 for the Domain of Conscientiousness. My score of ?1 produced a Escore of 38452. For Conscientiousness, my score is approximately 13.3 SD lower than the mean, revealing small differential from the population. The 3M score ofthe population is 55, 55 and 55 respectively with SD of 1.2 for the Domain of Extraversion. My score of 55 produced a 2score of D. For Extraversion, my score is equal to the mean, revealing no difference from the population. The 3M score ofthe population is 34.3, 34 and 84 respectively with SD of 1.2 for the Domain of Agreeableness. My score of 84 produced a z-score of D.25. For Agre eableness, my score is approximately a fourth of a 5D lower than the mean, revealing minor differential from the population. Lastly the 3M score of the population is 55.5, 99 and 59 respectively with SD of 1.3 for the Domain of Neuroticism. My score of 55 produced a ascore of 43.38452. I also attained 2 for Social Desirability. For Neuroticism, my score is approximately [1.3 SD lower than the mean, revealing minor differential from the population. Instances 100 160 120 140 80 40 60 20 0 [26, 31.7] (31.7, 37.4] (37.4, 43.1] (43.1, 48.8] *Highlighted bar indicates the group I belong to from assessment (48.8, 54.5] (54.5, 60.2] (60.2, 65.9] (65.9, 71.6] Neuroticism Score Range (71.6, 77.3] (77.3, 83] (83, 88.7] (88.7, 94.4] (94.4, 100.1] (100.1, 105.8] (105.8, 111.5] (111.5, 117.2]
Step by Step Solution
There are 3 Steps involved in it

Get step-by-step solutions from verified subject matter experts