

Question: please I need them. thank you Interpret Cash Flow Patterns and Ratios The following information is taken from the 2018 Form 10-K for each of
 please I need them. thank you
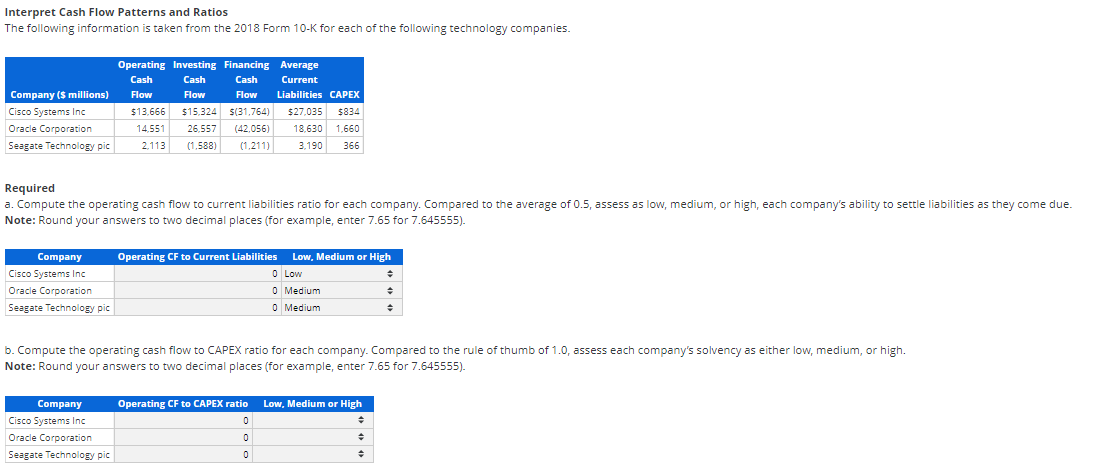
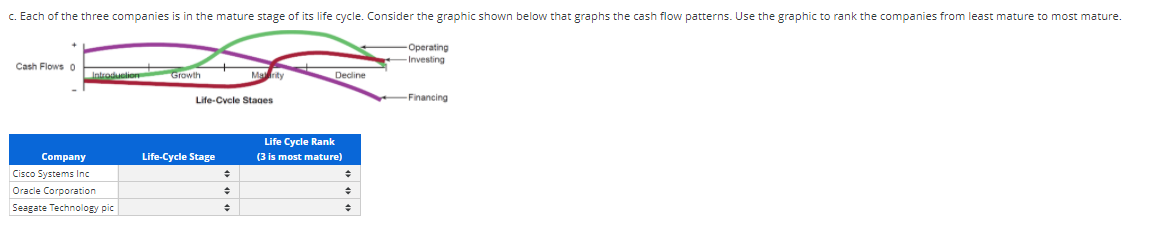
Interpret Cash Flow Patterns and Ratios The following information is taken from the 2018 Form 10-K for each of the following technology companies. Company (s millions) Cisco Systems Inc Oracle Corporation Seagate Technology pic Operating Investing Financing Average Cash Cash Cash Current Flow Flow Flow Liabilities CAPEX $13.666 $15.324 $15.324 $(31,764) ) $27.035 $834 14.551 26.557 (42.056) 18,630 1,660 2.113 (1.588) (1.211) 3.190 366 Required a. Compute the operating cash flow to current liabilities ratio for each company. Compared to the average of 0.5, assess as low, medium, or high, each company's ability to settle liabilities as they come due. Note: Round your answers to two decimal places (for example, enter 7.65 for 7.645555). Company Cisco Systems Inc Oracle Corporation Seagate Technology pic Operating CF to Current Liabilities Low, Medium or High 0 Low 0 Medium 0 Medium b. Compute the operating cash flow to CAPEX ratio for each company. Compared to the rule of thumb of 1.0, assess each company's solvency as either low, medium, or high. Note: Round your answers to two decimal places (for example, enter 7.65 for 7.645555). Low, Medium or High Operating CF to CAPEX ratio 0 Company Cisco Systems Inc Oracle Corporation Seagate Technology pic 0 0 c. Each of the three companies is in the mature stage of its life cycle. Consider the graphic shown below that graphs the cash flow patterns. Use the graphic to rank the companies from least mature to most mature. -Operating -Investing Cash Flows o Introduction Growth Marity Decline Life-Cycle Stages -Financing Life-Cycle Stage Life Cycle Rank (3 is most mature) Company Cisco Systems Inc Oracle Corporation Seagate Technology pic
Step by Step Solution
There are 3 Steps involved in it

Get step-by-step solutions from verified subject matter experts