

Question: Please, if possible use Excel formulas, cell references, & horizontal timelines to show work. You have estimated the following probability distributions of expected future returns
Please, if possible use Excel formulas, cell references, & horizontal timelines to show work.
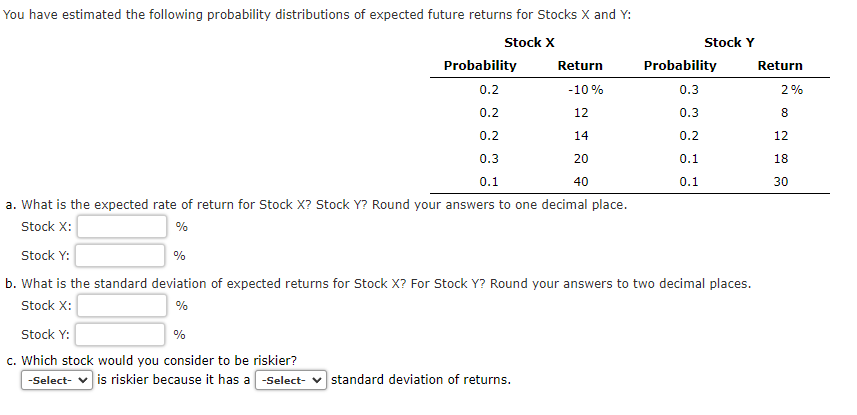
You have estimated the following probability distributions of expected future returns for Stocks X and Y:
| Stock X | Stock Y | ||||||
| Probability | Return | Probability | Return | ||||
| 0.2 | -10 | % | 0.3 | 2 | % | ||
| 0.2 | 12 | 0.3 | 8 | ||||
| 0.2 | 14 | 0.2 | 12 | ||||
| 0.3 | 20 | 0.1 | 18 | ||||
| 0.1 | 40 | 0.1 | 30 | ||||
What is the expected rate of return for Stock X? Stock Y? Round your answers to one decimal place. Stock X: %
Stock Y: %
What is the standard deviation of expected returns for Stock X? For Stock Y? Round your answers to two decimal places. Stock X: %
Stock Y: %
- Which stock would you consider to be riskier? -Select- is riskier because it has a -Select- standard deviation of returns.
a. What is the expected rate of return for Stock X ? Stock Y ? Round your answers to one decimal place. Stock X: % Stock Y : % b. What is the standard deviation of expected returns for Stock X? For Stock Y? Round your answers to two decimal places. Stock X : % Stock Y : % c. Which stock would you consider to be riskier? is riskier because it has a standard deviation of returns
Step by Step Solution
There are 3 Steps involved in it

Get step-by-step solutions from verified subject matter experts