

Question: Please i'll thumb up Using this data set complete the Questions. All measurements are given in grams. References on how to complete this will be
Please i'll thumb up
Using this data set complete the Questions. All measurements are given in grams.
References on how to complete this will be added at the bottom as images.
1. Mass of individual pennies: 2.473 2.519 2.482 2.534 2.501 2.518 2.507 3.061 2.532 2.480 3. Mass of 10 pennies (stacked together) 25.605 4. Mass of 10 pennies spread out on pan (measured together) 25.606
- Correctly use an analytical balance to measure mass and calculate the mean, standard deviation, and relative standard deviation.
- Analyze a set of measurements and determine if a suspected value should be kept or rejected to improve precision.
- Mass of Pennies
| 1.
| 2. | 3. | 4. | 5. |
| 6.
| 7. | 8. | 9. | 10. |
- Total mass of 10 pennies (added from above) ___________________
- Mass of 10 pennies (stacked together, and placed in the center of balance) ___________________
- Mass of 10 pennies spread out on pan (measured together) ___________________
Q-Test Determination
- Value of suspect datum ___________________
- Gap ___________________
- Range ___________________
- Q-calculated ___________________
- Is it okay to reject this value? ___________________
- Show calculations for the Q-Test.
- Determine the average, standard deviation, and relative standard deviation of your data (if you determined a data point should be rejected, then do not include it in your calculations). Show your work to receive credit.
Average _________________
Standard Deviation _________________
Relative Standard Deviation _________________
- Given the accepted mass of a U.S. penny is 2.5 g, calculate the %error and comment on the accuracy and precision of your data.
- Provide an explanation for any discrepancy you find in lines 2 through 4 of your data sheet.
References on how to complete this
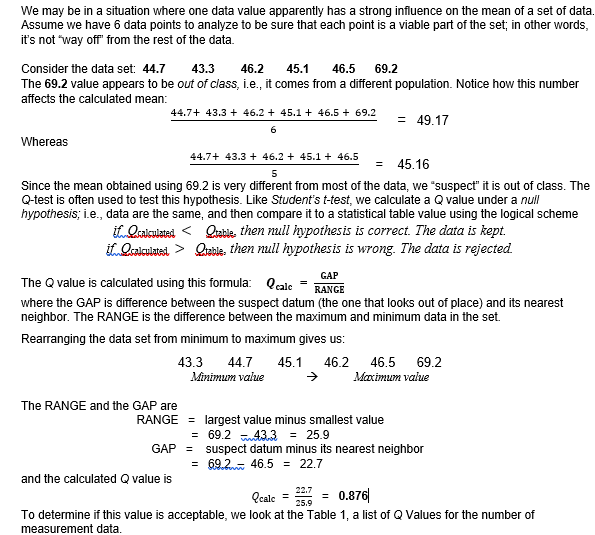
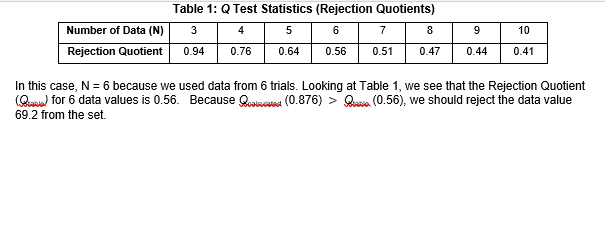
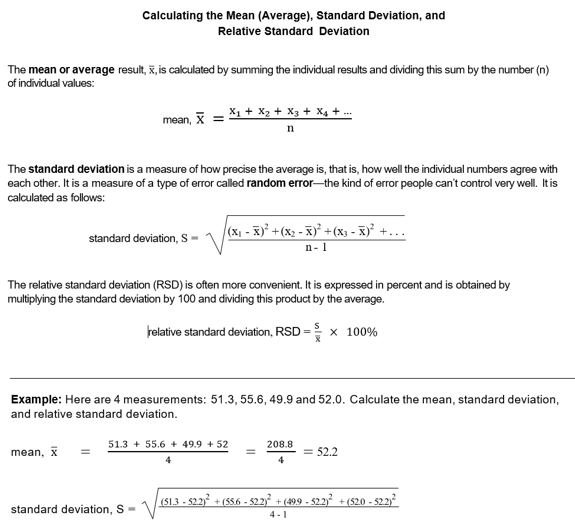
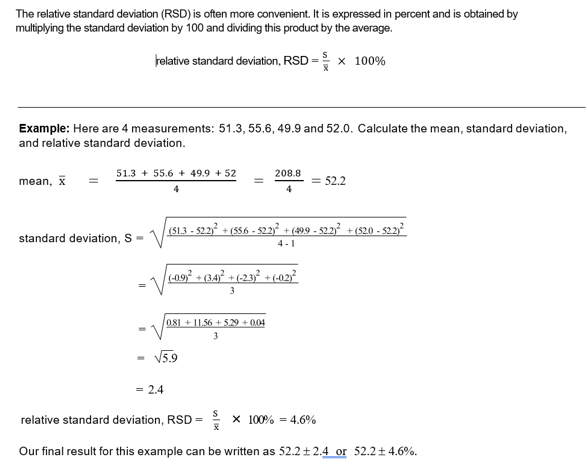
We may be in a situation where one data value apparently has a strong influence on the mean of a set of data. Assume we have 6 data points to analyze to be sure that each point is a viable part of the set; in other words, it's not 'way off from the rest of the data. Consider the data set: 44.7 43.3 46.2 45.1 46.5 69.2 The 69.2 value appears to be out of class, i.e., it comes from a different population. Notice how this number affects the calculated mean: 44.7+ 43.3 + 46.2 + 45.1 + 46.5 + 69.2 = 49.17 Whereas 44.7+ 43.3 + 46.2 + 45.1 + 46.5 45.16 Since the mean obtained using 69.2 is very different from most of the data, we 'suspect" it is out of class. The Q-test is often used to test this hypothesis. Like Student's t-test, we calculate a Q value under a null hypothesis; i.e., data are the same, and then compare it to a statistical table value using the logical scheme it calculated Otable, then null hypothesis is wrong. The data is rejected 6 5 GAP RANGE The Q value is calculated using this formula: calc where the GAP is difference between the suspect datum (the one that looks out of place) and its nearest neighbor. The RANGE is the difference between the maximum and minimum data in the set. Rearranging the data set from minimum to maximum gives us: 43.3 44.7 45.146.2 46.5 69.2 Minimum value Mocimum value The RANGE and the GAP are RANGE = largest value minus smallest value = 69.2 -43.3 = 25.9 GAP suspect datum minus its nearest neighbor = 69.2 46.5 = 22.7 and the calculated Q value is Ccalc = 259 0.876 To determine if this value is acceptable, we look at the Table 1, a list of Q Values for the number of measurement data Table 1: Q Test Statistics (Rejection Quotients) 3 4 5 6 7 9 10 Number of Data (N) Rejection Quotient 0.94 0.76 0.64 0.56 0.51 0.47 0.44 0.41 In this case, N = 6 because we used data from 6 trials. Looking at Table 1, we see that the Rejection Quotient Queria) for 6 data values is 0.56. Because Oculated (0.876) > Quia (0.56), we should reject the data value 69.2 from the set Calculating the Mean (Average), Standard Deviation, and Relative Standard Deviation The mean or average result, X, is calculated by summing the individual results and dividing this sum by the number (n) of individual values: mean, X = x2 + x2 + x3 + xy + .. n The standard deviation is a measure of how precise the average is, that is, how well the individual numbers agree with each other. It is a measure of a type of error called random errorthe kind of error people can't control very well. It is calculated as follows: standard deviation, S (x - 2) +(x2 - x)2 + (x3 - x) +... n-1 The relative standard deviation (RSD) is often more convenient. It is expressed in percent and is obtained by multiplying the standard deviation by 100 and dividing this product by the average. relative standard deviation, RSD 100% Example: Here are 4 measurements: 51.3,55.6, 49.9 and 52.0. Calculate the mean, standard deviation, and relative standard deviation. 51.3 + 55.6 + 49.9 +52 208.8 mean, x = 52.2 (513 - 52.27 + (55.6 - 52.232 + (499 - 52.2, + (520 - 52.22 standard deviation, S- 4-1 The relative standard deviation (RSD) is often more convenient. It is expressed in percent and is obtained by multiplying the standard deviation by 100 and dividing this product by the average. relative standard deviation, RSD = x 100% Example: Here are 4 measurements: 51.3,55.6, 49.9 and 52.0. Calculate the mean, standard deviation, and relative standard deviation. 51.3 + 55.6 + 49.9 + 52 208.8 mean, x 52.2 (51.3 - 52.2, + (55.6 - 522) + (499 - 52.232 + (52.0 - 522) standard deviation, S- 4-1 -09 +(3.4, +(223)+(02)2 3 081 +11.56 +5.29 +0,04 3 5.9 = 2.4 relative standard deviation, RSD X 100% = 4.6% Our final result for this example can be written as 52.2 2.4 or 52.2 + 4.6%. We may be in a situation where one data value apparently has a strong influence on the mean of a set of data. Assume we have 6 data points to analyze to be sure that each point is a viable part of the set; in other words, it's not 'way off from the rest of the data. Consider the data set: 44.7 43.3 46.2 45.1 46.5 69.2 The 69.2 value appears to be out of class, i.e., it comes from a different population. Notice how this number affects the calculated mean: 44.7+ 43.3 + 46.2 + 45.1 + 46.5 + 69.2 = 49.17 Whereas 44.7+ 43.3 + 46.2 + 45.1 + 46.5 45.16 Since the mean obtained using 69.2 is very different from most of the data, we 'suspect" it is out of class. The Q-test is often used to test this hypothesis. Like Student's t-test, we calculate a Q value under a null hypothesis; i.e., data are the same, and then compare it to a statistical table value using the logical scheme it calculated Otable, then null hypothesis is wrong. The data is rejected 6 5 GAP RANGE The Q value is calculated using this formula: calc where the GAP is difference between the suspect datum (the one that looks out of place) and its nearest neighbor. The RANGE is the difference between the maximum and minimum data in the set. Rearranging the data set from minimum to maximum gives us: 43.3 44.7 45.146.2 46.5 69.2 Minimum value Mocimum value The RANGE and the GAP are RANGE = largest value minus smallest value = 69.2 -43.3 = 25.9 GAP suspect datum minus its nearest neighbor = 69.2 46.5 = 22.7 and the calculated Q value is Ccalc = 259 0.876 To determine if this value is acceptable, we look at the Table 1, a list of Q Values for the number of measurement data Table 1: Q Test Statistics (Rejection Quotients) 3 4 5 6 7 9 10 Number of Data (N) Rejection Quotient 0.94 0.76 0.64 0.56 0.51 0.47 0.44 0.41 In this case, N = 6 because we used data from 6 trials. Looking at Table 1, we see that the Rejection Quotient Queria) for 6 data values is 0.56. Because Oculated (0.876) > Quia (0.56), we should reject the data value 69.2 from the set Calculating the Mean (Average), Standard Deviation, and Relative Standard Deviation The mean or average result, X, is calculated by summing the individual results and dividing this sum by the number (n) of individual values: mean, X = x2 + x2 + x3 + xy + .. n The standard deviation is a measure of how precise the average is, that is, how well the individual numbers agree with each other. It is a measure of a type of error called random errorthe kind of error people can't control very well. It is calculated as follows: standard deviation, S (x - 2) +(x2 - x)2 + (x3 - x) +... n-1 The relative standard deviation (RSD) is often more convenient. It is expressed in percent and is obtained by multiplying the standard deviation by 100 and dividing this product by the average. relative standard deviation, RSD 100% Example: Here are 4 measurements: 51.3,55.6, 49.9 and 52.0. Calculate the mean, standard deviation, and relative standard deviation. 51.3 + 55.6 + 49.9 +52 208.8 mean, x = 52.2 (513 - 52.27 + (55.6 - 52.232 + (499 - 52.2, + (520 - 52.22 standard deviation, S- 4-1 The relative standard deviation (RSD) is often more convenient. It is expressed in percent and is obtained by multiplying the standard deviation by 100 and dividing this product by the average. relative standard deviation, RSD = x 100% Example: Here are 4 measurements: 51.3,55.6, 49.9 and 52.0. Calculate the mean, standard deviation, and relative standard deviation. 51.3 + 55.6 + 49.9 + 52 208.8 mean, x 52.2 (51.3 - 52.2, + (55.6 - 522) + (499 - 52.232 + (52.0 - 522) standard deviation, S- 4-1 -09 +(3.4, +(223)+(02)2 3 081 +11.56 +5.29 +0,04 3 5.9 = 2.4 relative standard deviation, RSD X 100% = 4.6% Our final result for this example can be written as 52.2 2.4 or 52.2 + 4.6%
Step by Step Solution
There are 3 Steps involved in it

Get step-by-step solutions from verified subject matter experts