

Question: Please include steps in excel showing formulas 1. Consider the table below that summarizes the probability distributions of the two risky funds, a stock fund
 Please include steps in excel showing formulas
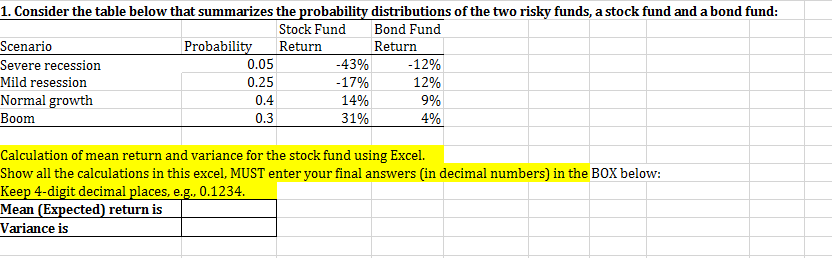
1. Consider the table below that summarizes the probability distributions of the two risky funds, a stock fund and a bond fund Stock FundBond Fund Probabili Return Return Scenario Severe recession Mild resession Normal growth Boom 0.05 0.25 0.4 0.3 .43% 17% 14% 31% 1290 1290 9% 4% Calculation of mean return and variance for the stock fund using Excel. Show all the calculations in this excel, MUST enter your final answers (in decimal numbers) in the BOX below: Keep 4-digit decimal places, e.g., 0.1234 Mean Variance is ected) return is
Step by Step Solution
There are 3 Steps involved in it
1 Expert Approved Answer
Step: 1 Unlock

Question Has Been Solved by an Expert!
Get step-by-step solutions from verified subject matter experts
Step: 2 Unlock
Step: 3 Unlock