

Question: Please interpret each slide in a separate paragraph. Why do you think India and China were the leading economies of the world at the beginning
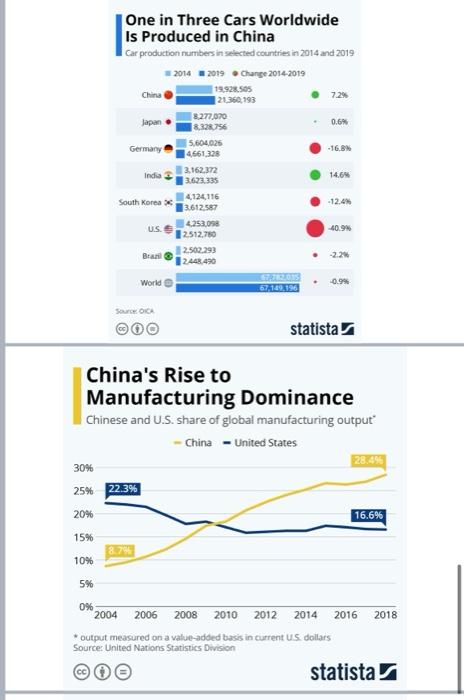
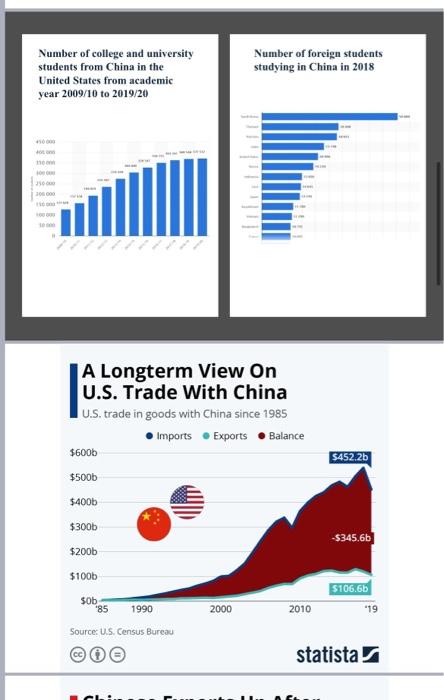
Please interpret each slide in a separate paragraph.
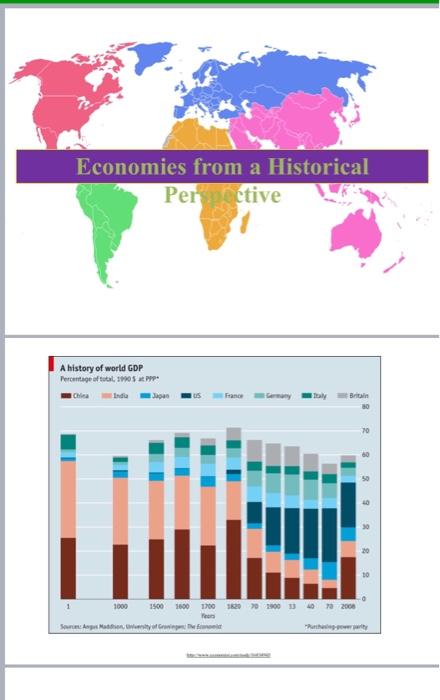
Why do you think India and China were the leading economies of the world at the beginning of time (as mentioned in the economist chart)?
Why do you think those countries might have lost their dominant positions? Are these countries coming back to retake their glorious positions from the bygone era?
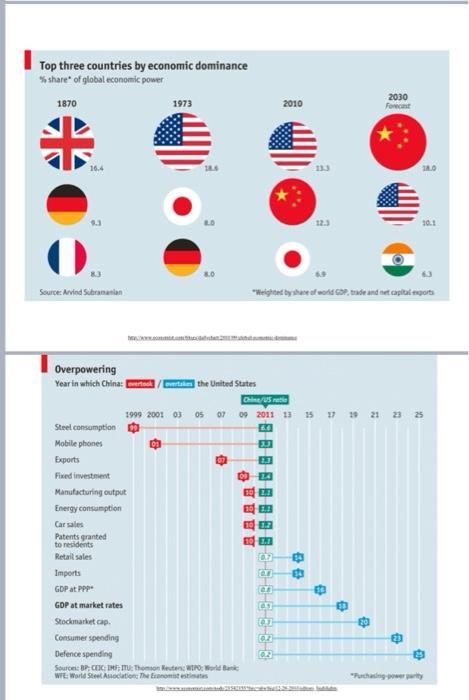
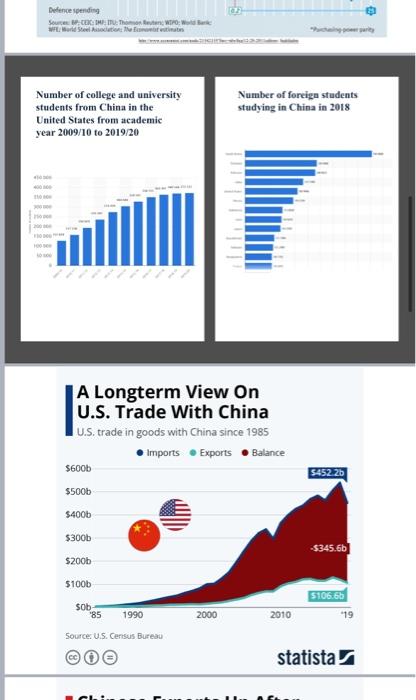
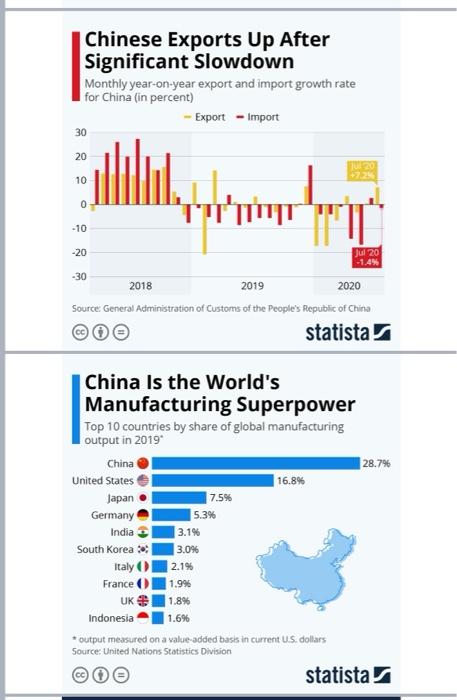
Do you think that China is positioned to be the worlds largest economy (please refer to the charts from 6-14)?
In your opinion, what would the US have to do to ensure that its position in the global economy is not threatened?

Step by Step Solution
There are 3 Steps involved in it
1 Expert Approved Answer
Step: 1 Unlock

Question Has Been Solved by an Expert!
Get step-by-step solutions from verified subject matter experts
Step: 2 Unlock
Step: 3 Unlock