

Question: Please let me know if question 1-3 is right and I need the rest of the parts, thank you! 1. Heights of MEN in the
Please let me know if question 1-3 is right and I need the rest of the parts, thank you!
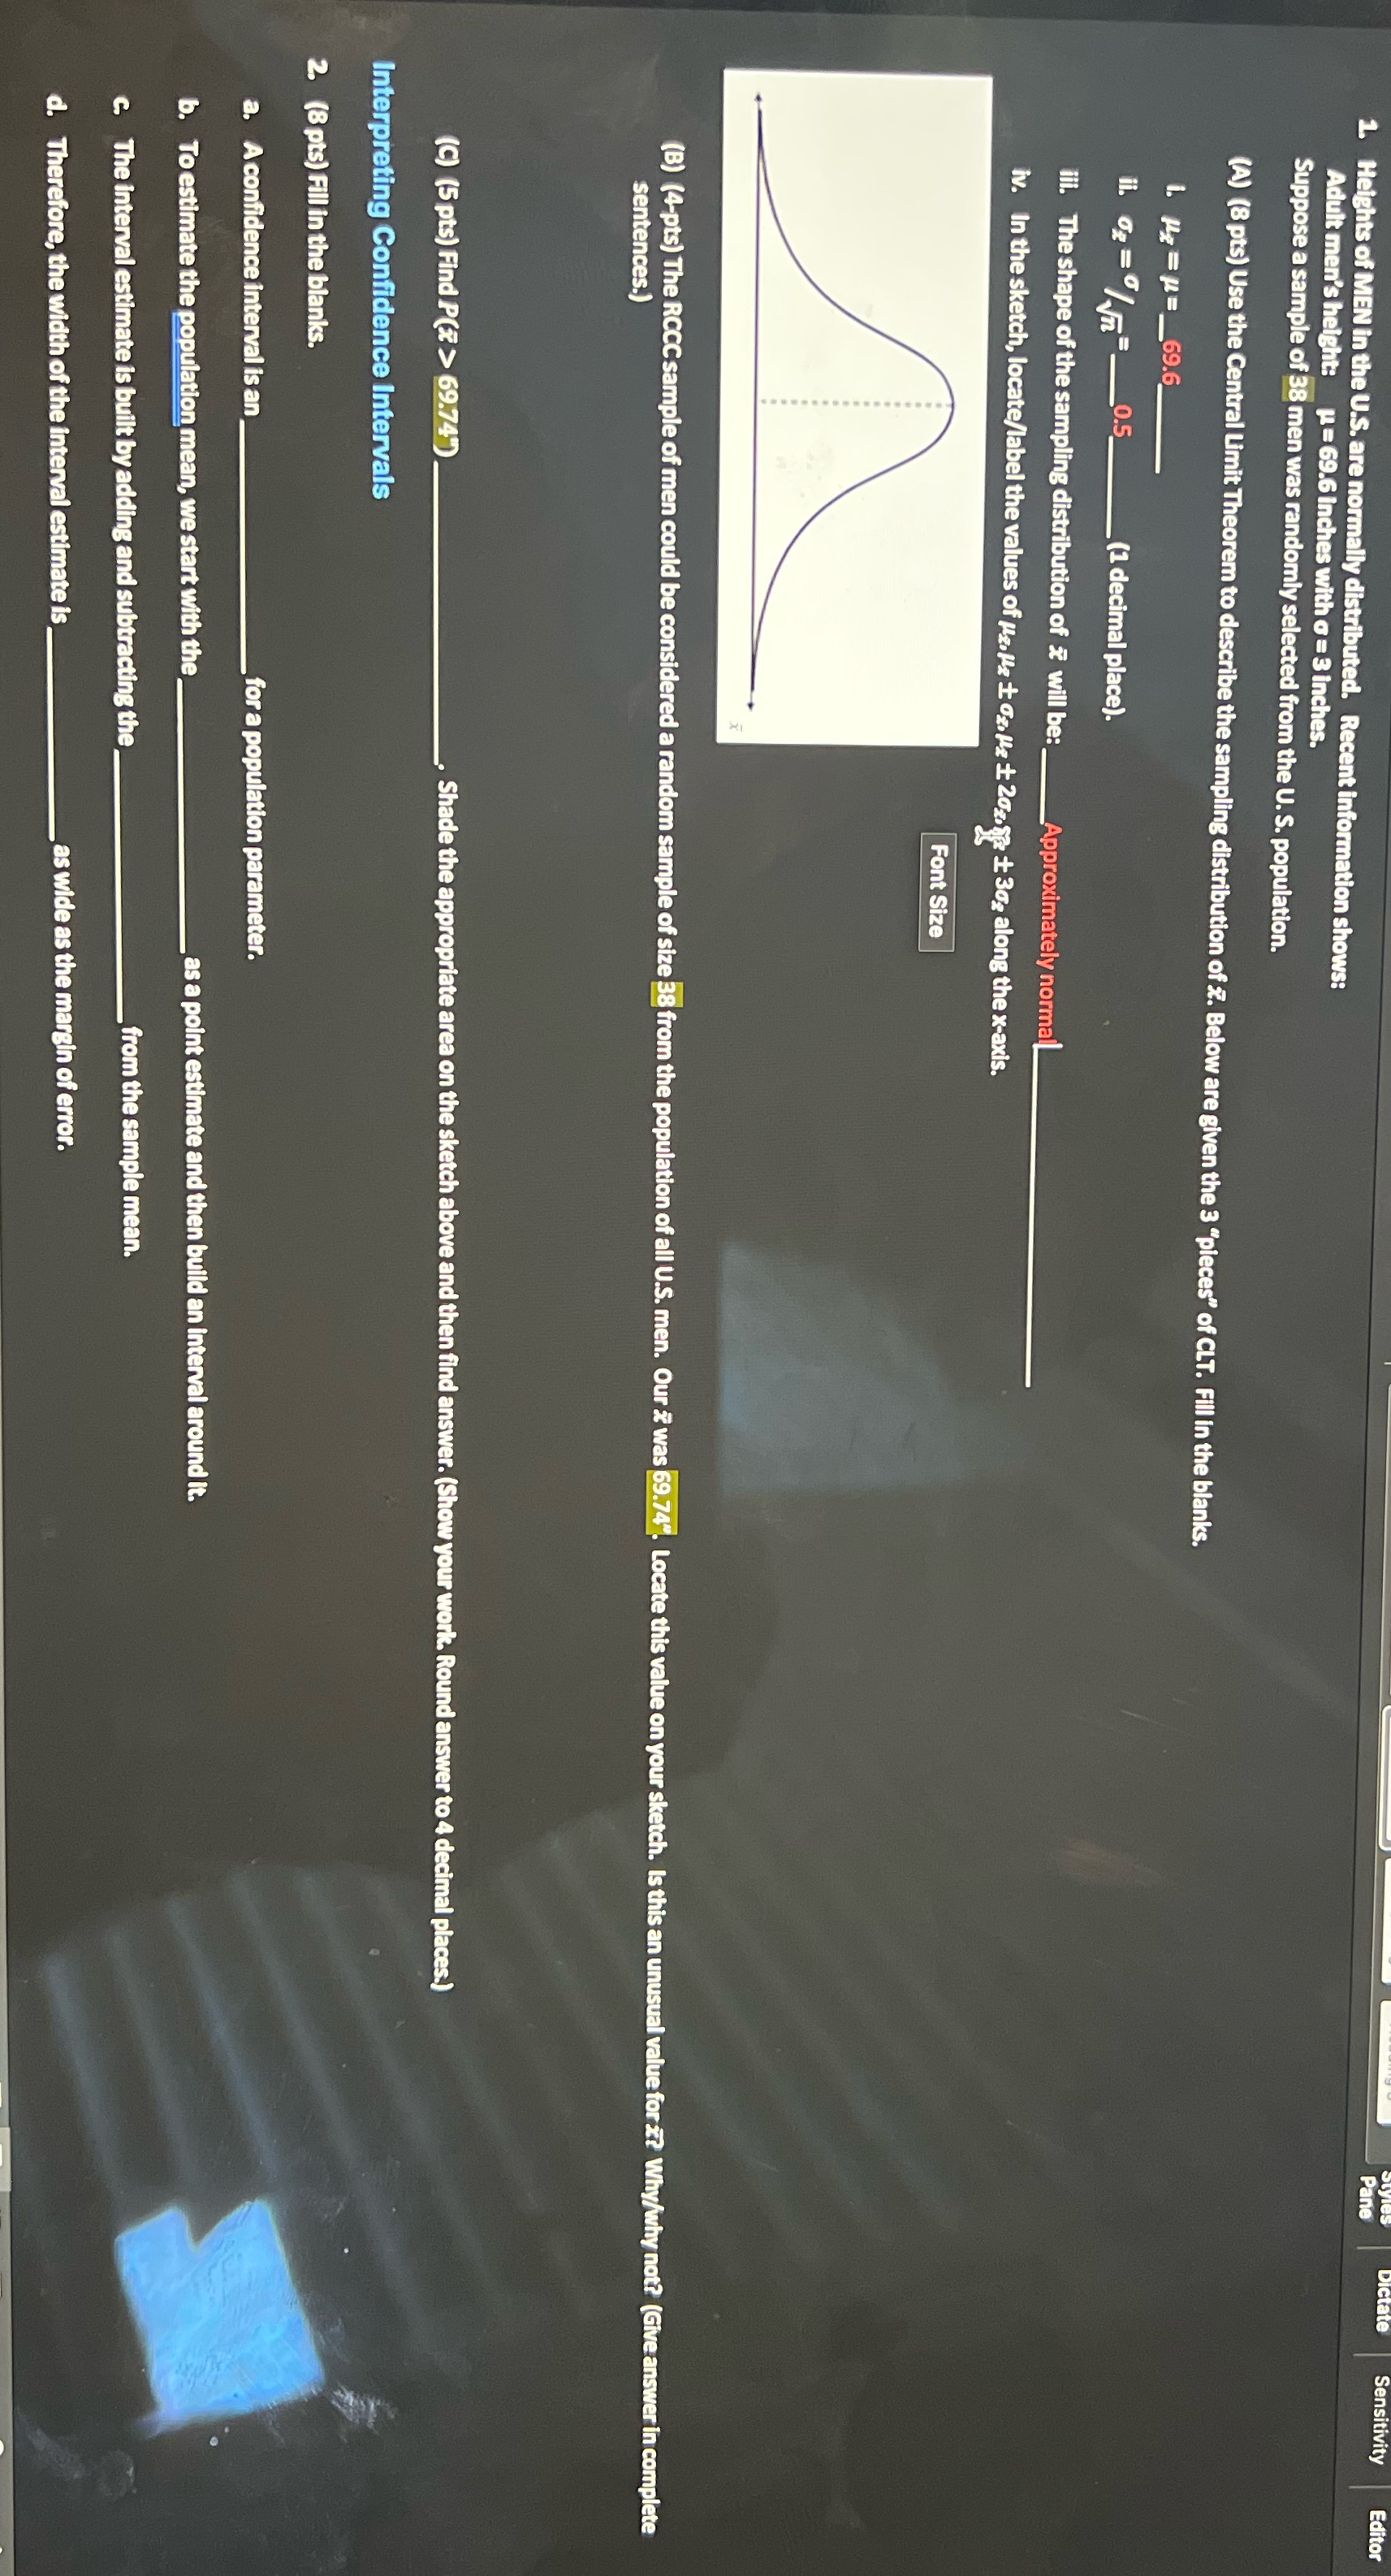
1. Heights of MEN in the U.S. are normally distributed. Recent information shows: ane Sensitivity Editor Adult men's height: u = 69.6 inches with a = 3 inches. Suppose a sample of 38 men was randomly selected from the U. S. population. (A) (8 pts) Use the Central Limit Theorem to describe the sampling distribution of Z. Below are given the 3 "pieces" of CLT. Fill in the blanks. 1. He = =_69.6 ii. 68 = /.=0.5 (1 decimal place). ili. The shape of the sampling distribution of & will be:_ Approximately normal iv. In the sketch, locate/label the values of Hz.He 1 02. He + 202, fix + 302 along the x-axis. Font Size (B) (4-pts) The RCCC sample of men could be considered a random sample of size 38 from the population of all U.S. men. Our & was 69.74". Locate this value on your sketch. Is this an unusual value for x? Why/why not? (Give answer in complete sentences.) (C) (5 pts) Find P(X > 69.74") Shade the appropriate area on the sketch above and then find answer. (Show your work. Round answer to 4 decimal places.) Interpreting Confidence Intervals 2. (8 pts) Fill in the blanks. a. A confidence interval is an_ for a population parameter. b. To estimate the population mean, we start with the as a point estimate and then build an interval around it. C. The interval estimate is built by adding and subtracting the from the sample mean. d. Therefore, the width of the interval estimate is as wide as the margin of error
Step by Step Solution
There are 3 Steps involved in it

Get step-by-step solutions from verified subject matter experts