

Question: please let me know what you did and how you got the answer thank you!!! begin{tabular}{|c|c|c|c|c|c|c|c|c|c|c|c|c|} hline 3 & LOT # & PRONECT # &
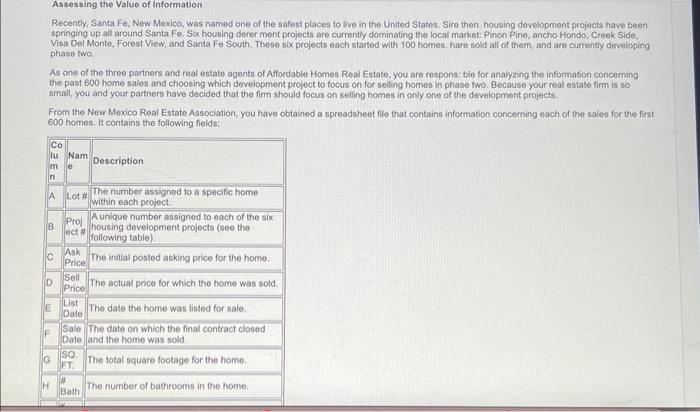
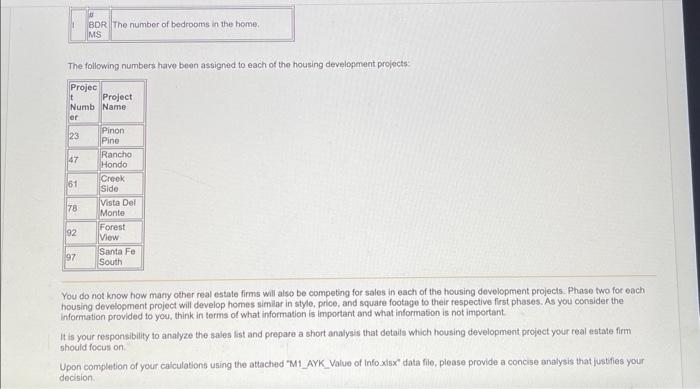

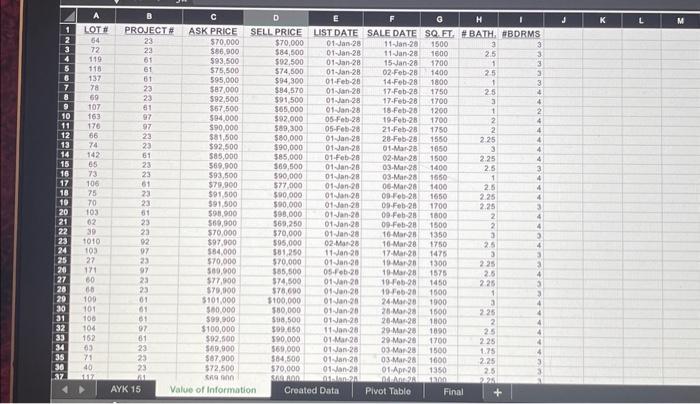
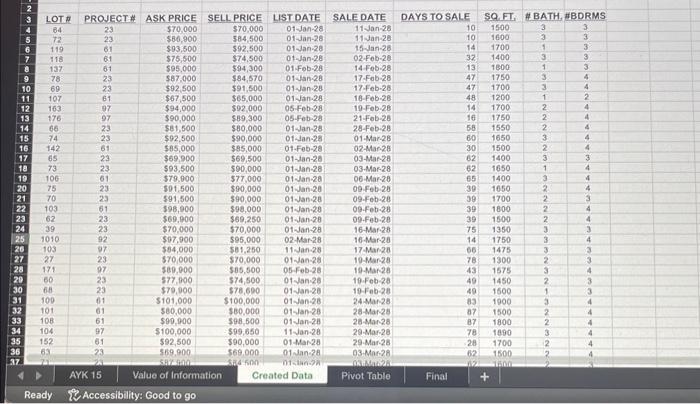
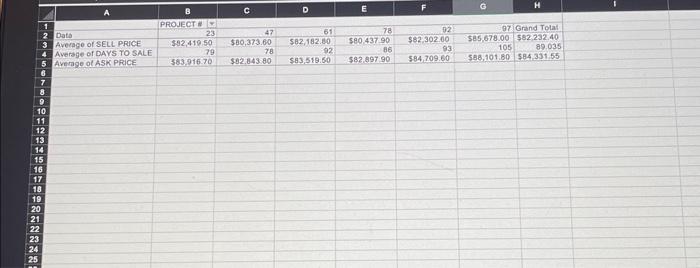
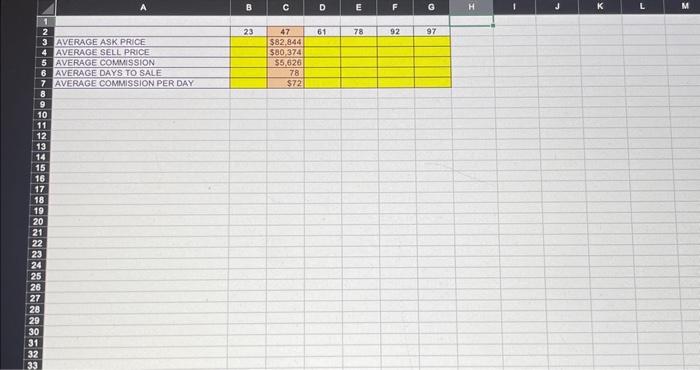
\begin{tabular}{|c|c|c|c|c|c|c|c|c|c|c|c|c|} \hline 3 & LOT # & PRONECT \# & ASK PRICE & SELLPRICE & UIST DATE & SALEDATE & DAYS TO SALE & SQFI. & \#BATH, & 1. \#BDRMS & & \\ \hline 4 & 64 & 23 & $70,000 & $70,000 & 01 Jan-28. & 11 Jan26 & 10 & 1500 & 3 & 3 & & \\ \hline 5 & 72 & 23 & $80,900 & $84,500 & 01-Jan-28 & 11 Jan-28 & 10 & 1600 & 3 & 3 & & \\ \hline 6 & 119 & 61 & $93,500 & $92,500 & 01 Jan -28 & 15Nan-28 & 14 & 1700 & 1 & 3 & & \\ \hline 7 & 118 & 61 & $75,500 & $74,500 & 0 t lan28 & 02Fb20 & 32. & 1400 & 3 & 3 & & \\ \hline & 137. & 61 & 595,000 & 594,300 & 01.Fob -28 & 14F0028 & 13 & 1800 & 1 & 3 & & \\ \hline 9 & 78 & 23 & $87,000 & $84,570 & 01van-28 & 17. Fob-28 & 47 & 1750 & 3 & 4 & & \\ \hline 10 & 69 & 23 & $92,500 & $91,500 & 01. Jan 28 & 17feb28 & 47 & 1700 & 3 & 4 & & \\ \hline 11 & 107 & 61 & $67,500 & $65,000 & O1 van.28 & 16Fob-28 & 48 & 1200 & 1 & 2 & & \\ \hline 12 & 163 & 97 & $94,000 & $92,000 & OS-Fob-28 & 19-Fob-28 & 14 & 1700 & 2 & 4 & & \\ \hline 13 & 176 & 97 & $90,000 & $89,300 & OS-Fob-28 & 21b2B & 16 & 1750 & 2 & 4 & & \\ \hline 14 & 66 & 23 & $81,500 & $80,000 & 01 Jan-28 & & 58 & 1550 & 2 & 4 & & \\ \hline 15 & 74 & 23 & $92.500 & $90,000 & 01:Jan-28. & 01 Mar.28 & 60 & 1650 & 3 & 4 & & \\ \hline 16 & 142 & 61 & $85,000 & $95,000 & 01F0b28 & 02-Mar28 & 30 & 1500 & 2 & 4 & & \\ \hline 17 & 65 & 23 & $69.900 & $69,500 & & 03Mar28 & 62 & 1400 & 3 & 3 & & \\ \hline 10 & 73 & 23 & $93,500 & $500,000 & 01 van-28 & 03Mar28 & 62 & 1650 & 1 & 4 & & \\ \hline 10 & 106 & 61 & $79.900 & $777,000 & ot van-28 & 06 -Mar-28 & 65 & 1400 & 3 & 4 & & \\ \hline 20 & 75 & 23 & 501,500 & $90,000 & 01 Jan.28 & 09 Feb-20 & 30 & 1650 & 2. & 4 & & \\ \hline 21 & 70 & 23 & 591,500 & $90,000 & 01 Jan.28 & 09Feb28 & 39 & 1700 & 2 & 3 & & \\ \hline 22 & 103 & 61 & $98,900 & $98,000 & 01 Jan-28 & 09Fob28 & 39 & 1800 & 2 & 4 & & \\ \hline 23 & 62 & 23 & $69,900 & $69,250 & O1Jan-28 & 09.Fob28 & 39 & 1500 & 2 & 4 & & \\ \hline 24 & 39 & 23 & $70,000 & $70,000 & O1 van 28 & 16-Mar.28 & 75 & 1350 & 3 & 3 & & \\ \hline 25 & 1010 & 92 & $97,900 & $95,000 & 02-Mar28 & 16-Mar-28 & 14 & 1750 & 3 & 4 & & \\ \hline 20 & 103 & 97 & $84,000 & $801,250 & 11 Van-28 & 17Mar28B & 66 & 1475 & 3 & 3 & & \\ \hline 27 & 27 & 23 & $70,000 & $70,000 & 01 van-28 & 10Man28 & 78 & 1300 & 2 & 3 & & \\ \hline 28 & 171 & 97 & 560,000 & $80,500 & 06f=b28 & 19Mar28 & 43 & 1575 & 3 & 4 & & \\ \hline 20 & 60 & 23 & $77,900 & $74,500 & 01 van 28 & 10Fob20 & 40 & 1450 & 2 & 3 & & \\ \hline 30 & 68 & 23 & $70.900 & $78,690 & O1 van 28 & 19F=028 & 49 & 1500 & i & 3 & & \\ \hline 31 & 100 & 61 & $101,000 & $100,000 & 01 tan-28 & 24Man28 & 83 & 1900 & 3 & 4 & & \\ \hline 32 & 101 & 61 & $80,000 & $80,000 & Ot Jan-28 & 28Mar28 & a? & 1500 & 2 & 4 & & \\ \hline 33 & 108 & 61 & $90,900 & $98,600 & 01 Jan-28 & 20 - tan28 & 87 & 1800 & 2 & 4 & & \\ \hline 34 & 104 & 97 & $100,000 & $09.650 & 11tan28 & 29-Mar-28 & 78 & 1090 & 3 & 4 & & \\ \hline 35 & 152 & 61 & 592,500 & $90,000 & 01 than28 & 29-Mar.28 & 2 & 1700 & 2. & 4 & & \\ \hline 36 & 63 & 23 & 869.900 & 569.000 & 01 Jan-2B & 03 Mar-28 & 62 & 1500 & 2 & 4 & & \\ \hline 37 & -2 & & sersiana & 45mm2 & & & & & & & & \\ \hline 4 & D & AYK 15 & Value of Informa & ation & eated Data & Pivot Table & Final & + & & & & \\ \hline & Ready & 2Accessibi & Fility: Good to go & & & & & & & & & \\ \hline \end{tabular} Apply Your Knowledge Project 15 - Assessing the Value of Information 1. In the document you will go to the Final worksheet to complete the calculations. 2. You will notice that the Tan boxes are an example, but the yellow boxes are where you need to complete your calculations. You will use cell references to the Pivot Table and mathmatical formulas to complete the calculations. 3. Please note: Use 7% as the commission amount. The following numbers havo been assigned to each of the housing development projects: You do not know how many other real estate firms will also be competing for sales in each of the housing dovelopment projects. Phase two for each housing development project will develop homes similar in style, price, and square foothge to their fespective first phases. As you consider the information provided to you, think in terms of what information is important and what informasion is not important. It is your responsibility to analyze the sales list and prepare a short analysis that details which housing development project your real estate firm should focus on Upon completion of your calculations using the attached "MI AYK Value of info xisx" data file, please provide a concise analysis that justifies your decision Recently, Santa Fe, New Moxico, was named one of the safest places to tive in the United States. Sire then. housing development projects have been springing up all around Santa Fe. Skx housing derer ment projects are currently dominating the local market: Pinon Pine, ancho tiondo, Creek Side, Visa Del Monte, Forest View, and Santa Fe South. These six projects each started with 100 homes. hare sold all of them, and are currently developing phase two. As one of the three partners and real estate agents of Affordable Homes Real Estate, you are respons: ble for analyzing the information concerning the past 600 home sales and choosing which development project to focus on for selling homes in phase two. Because your real estate firm is so small, you and your partnors have decided that the firm should focus on selling homes in only one of the development projects. From the New Mexico Real Estate Association, you have obtained a spreadsheet file that contains information concerning each of the sales for the first 600 homes, It contains the following fields: \begin{tabular}{|c|c|c|c|c|c|c|c|c|c|c|c|c|c|} \hline & A & B & c & D & E & F & 0 & H & 1 & J & & L & M \\ \hline 1 & LOT \# & PROUECT \# & ASKPRICE & SELLPRICE & LIST DATE & SALEDATE & SQFI & \#BATH, & ABDRMS & & & & \\ \hline 2 & 64 & 23 & $70,000 & $770,000 & O1 Jan 28 & 11 Jan-20 & 1500 & 3 & 3 & & & & \\ \hline 3 & 72 & 23 & $86,900 & $84,500 & Of Jan-28 & 11. anan28 & 1500 & 2.5 & 3 & & & & \\ \hline 4 & 119 & 61 & 593.500 & & O1. 1 an 28 & 15tan28 & 1700 & 1 & 3 & & & & \\ \hline 5 & 110 & 61 & $775,500 & $74,500 & 01 dan-28 & 02F=b28 & 1400 & 25 & 3 & & & & \\ \hline 6 & 137 & 61 & 595,000587,000 & $94,300 & 01-feb-20 & 14F=b28 & 1800 & 1 & 3 & & & & \\ \hline 7 & 78 & 23 & $87,000592,500 & $84,570 & O1van-28 & 17Fob-28 & 1750 & 25 & & & & & \\ \hline 8 & 69 & 23 & 592,500857,500 & $91,500 & 01 van 28 & 17-Feb-28 & 1700 & 3 & 4 & & & & \\ \hline 9 & 107 & 61 & $67,500594,000 & $65,000 & O1 van 28 & 18feb-28 & 1200 & 1 & 2 & & & & \\ \hline 10 & 163 & 97 & $94,000590,000 & 392.000 & 06 fob -28 & 19-Fob-2821.feb28 & 1700 & & 4 & & & & \\ \hline 11 & 170 & 97 & $50,000$81,500 & $80,300 & 05F0b28 & & 17501550 & 2 & 4 & & & & \\ \hline 12 & 66 & 23 & $81,500$92,500 & 520,000 & O1 Jan 28 & 28Fb28 & 1580 & 2.25 & 4 & & & & \\ \hline 13 & 74 & 23 & $92,500$95,000 & $90,000 & 01 Jan -28 & O1Mar:2B & 1050 & 3 & 4 & & & & \\ \hline 14 & 142 & 69 & 585,000 & $85,000 & 01+0b28 & O2- Nar28 & 1500 & 2.25 & 4 & & & & \\ \hline 15 & 65 & 23 & $69,000 & $69,500 & 01 Jan 2B & & 1400 & 2.5 & 3 & & & & \\ \hline 16 & 73 & 23 & $93,500 & 590,000 & 014an-28 & O3-Mar.28 & 1650 & 1 & 4 & & & & \\ \hline 17 & 106 & 61 & $79,900 & $77,000 & Of van 20 & 06Mar20 & 1400 & 2.52.5 & 4 & & & & \\ \hline 18 & 75 & 23 & $91,500 & $90,000 & & OPFob-2A & 16501700 & 225 & 4 & & & & \\ \hline 10 & 70 & 23 & $91,500 & 590,000 & O1 van 280 & & 17001800 & 2.25 & 3 & & & & \\ \hline 20 & 103 & 61 & $91,900 & $98,000 & Oi 2 an-20 & 00=0b28 & 18001500 & 2 & 4 & & & & \\ \hline 21 & 02 & 23 & $69,000 & $63,250 & 01 van.20 & ODFob-2B & 15001350 & ? & 4 & & & & \\ \hline 22 & 30 & 23 & $70,000 & $70,000 & 01 Jan.28 & 10MarzB & 13501750 & 23 & ? & & & & \\ \hline 23 & 1010 & D2 & $97,000 & $95,000 & 02man28 & 10-Mar28 & 17501475 & 2.5 & 4 & & & & \\ \hline 24 & 103 & 97 & $84,000 & 301,250 & 11lan20 & 17 Marzo & 1475 & 23 & 3. & & & & \\ \hline 25 & 27 & 23 & $70,000 & $70,000 & 01san20 & 10 Maryo & 13001578 & 22525 & 3. & & & & \\ \hline 20 & 171 & 97 & 300.900 & 385,500 & & 10Mar2B & 1575 & 2.5 & 4 & & & & \\ \hline 27 & 60 & 23 & 57,000 & 374,500 & 01lan20 & 10 fob 28 & 1450 & 225 & 3 & & & & \\ \hline 20 & 60 & 23 & $79,000 & $776,600 & O1 van 20 & & 1600 & 1 & 3 & & & & \\ \hline 20 & 100 & 01 & $101,000 & $100,000 & 01tan20 & 24Man20 & 1900 & 3 & 4 & & & & \\ \hline 30 & 101 & 61 & $00,000 & 800,000 & 01 tan 20 & 200028 & 1600 & 225 & 4 & & & & \\ \hline 1 & 100 & 81 & $99,900 & $98,500 & 01van20 & & 1600 & 22 & 4 & & & & \\ \hline 32 & 104 & a7 & $100,000 & 509,650 & 11 Jan 28 & 29Man28 & 1690 & 25 & 4 & & & & \\ \hline 33 & 162 & 61 & $92,500 & 590,000 & & 29Mar2B & 1700 & 225 & 4 & & & & \\ \hline & 69 & 23 & $09,900. & $60,000 & 01. van:28 & 03 Mar 28 & 1500 & 1.75 & 4 & & & & \\ \hline 35 & 71 & 23 & $67,900 & 504,500 & 01tan28 & 03 Mar-28 & 1600 & 225 & 3 & & & & \\ \hline 30 & 40. & 23 & $72,500 & $70,000 & 01van -28 & O1. App 20 & 1950 & 25 & 3 & & & & \\ \hline 37 & 1117 & K15 & sha man & a0 & & & & & & & & & \\ \hline 4 & & AYK 15 & Value of Informa & Creat & ted Data & Pivot Tablo & Fina & & & & & & \\ \hline \end{tabular}
Step by Step Solution
There are 3 Steps involved in it

Get step-by-step solutions from verified subject matter experts