

Question: Please look over my calculations Spreadsheet Exercise: Chapter 3 The income statement and balance sheet are the primary reports that a firm constructs for use
| Please look over my calculations Spreadsheet Exercise: Chapter 3 | ||||||||
The income statement and balance sheet are the primary reports that a firm constructs for use by management and for distribution to stockholders, regulatory bodies, and the general public. They are the primary sources of historical financial information about the firm. Dayton Products, Inc., is a moderate-sized manufacturer. The companys management has asked yo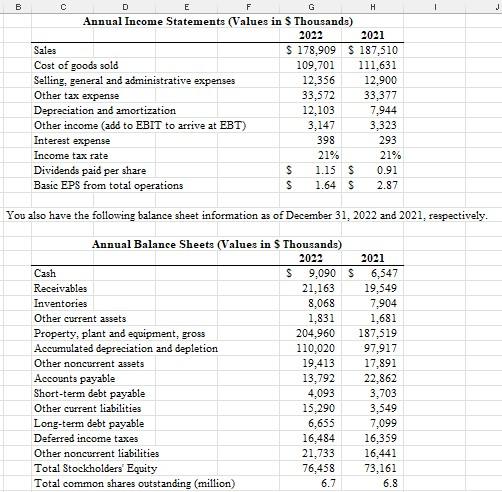 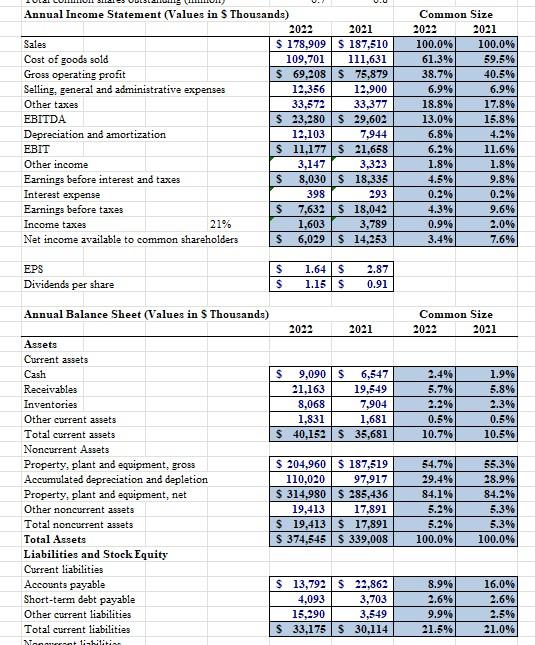 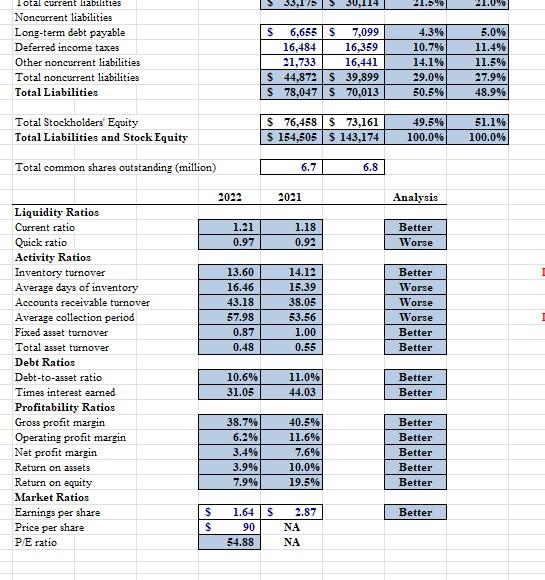 u to perform a detailed financial statement analysis of the fi u to perform a detailed financial statement analysis of the fi | ||||||||
You also have the following balance sheet information as of December 31,2022 and 2021, respectively. EPS Dividends per share \begin{tabular}{|ll|ll|} \hline$ & 1.64 & $ & 2.87 \\ \hline$ & 1.15 & $ & 0.91 \\ \hline \end{tabular} \begin{tabular}{|l|c|c|c|c|} \hline Annual Balance Sheet (Values in \$ Thousands) & & \multicolumn{2}{c|}{ Common Size } \\ & 2022 & 2021 & 2022 & 2021 \\ \hline \end{tabular} Current assets Cash Receivables Inventories Other current assets Total current assets Noncurrent Assets Property, plant and equipment, gross Accumvlated depreciation and depletion Property, plant and equipment, net Other noncurrent assets Total noncurrent assets Total Assets \begin{tabular}{|r|rr|r|r|} \hline$ & 9,090 & $6,547 & 2.4% & 1.9% \\ \hline 21,163 & 19,549 & 5.7% & 5.8% \\ \hline 8,068 & 7,904 & 2.2% & 2.3% \\ \hline 1,831 & 1,681 & 0.5% & 0.5% \\ \hline$ & 40,152 & $35,681 & 10.7% & 10.5% \\ \hline \end{tabular} Liabilities and Stock Equity Current liabilities Accounts payable Short-term debt payable Other corrent liabilities Total current liabilities \begin{tabular}{|r|r|r|r|} \hline$204,960 & $187,519 & 54.7% & 55.3% \\ \hline 110,020 & 97,917 & 29.4% & 28.9% \\ \hline$314,980 & $285,436 & 84.1% & 84.2% \\ \hline 19,413 & 17,891 & 5.2% & 5.3% \\ \hline$19,413 & $17,891 & 5.2% & 5.3% \\ \hline$374,545 & $339,008 & 100.0% & 100.0% \\ \hline \end{tabular} \begin{tabular}{|r|r|r|r|} \hline$13,792 & $22,862 & 8.9% & 16.0% \\ \hline 4,093 & 3,703 & 2.6% & 2.6% \\ \hline 15,290 & 3,549 & 9.9% & 2.5% \\ \hline$33,175 & $30,114 & 21.5% & 21.0% \\ \hline \end{tabular} Lotal corrent liabilities Noncurrent liabilities Long-term debt payable Deferred income taxes Other noncurrent liabilities Total noncurrent liabilities Total Liabilities \begin{tabular}{|rr|rr|r|r|} \hline$ & 6,655 & $ & 7,099 & 4,3% & 5.0% \\ \hline & 16,484 & & 16,359 & 10.7% & 11.4% \\ \hline & 21,733 & & 16,441 & 14.1% & 11.5% \\ \hline$ & 44,872 & $ & 39,899 & 29.0% & 27.9% \\ \hline$ & 78,047 & $ & 70,013 & 50.5% & 48.9% \\ \hline \end{tabular} Total Stockholders' Equity Total Liabilities and Stock Equity \begin{tabular}{|r|rr|r|r|} \hline$76,458 & 73,161 & 49.5% & 51.1% \\ \hline$154,505 & $143,174 & 100.0% & 100.0% \\ \hline \end{tabular} Total common shares outstanding (million) \begin{tabular}{|l|l|} \hline 6.7 & 6.8 \\ \hline \end{tabular} \begin{tabular}{l} Liquidity Ratio \\ Current ratio \\ Quick ratio \\ Activity Ratios \\ \hline \end{tabular} Inventory turnover Average days of inventory Accounts receivable turnover Average collection period Fixed asset turnover Total asset turnover Debt Ratios Debt-to-asset ratio Times interest earned \begin{tabular}{|r|r|} \multicolumn{1}{|c|}{2022} & \multicolumn{1}{|c|}{2021} \\ \hline 1.21 & 1.18 \\ \hline 0.97 & 0.92 \\ \hline \end{tabular} Analysis Profitability Ratios Gross profit margin Operating profit margin Net profit margin Return on assets Return on equity \begin{tabular}{|r|r|} \hline 13.60 & 14.12 \\ \hline 16.46 & 15.39 \\ \hline 43.18 & 38.05 \\ \hline 57.98 & 53.56 \\ \hline 0.87 & 1.00 \\ \hline 0.48 & 0.55 \\ \hline \end{tabular} \begin{tabular}{|l|} \hline Better \\ \hline Worse \\ \hline \end{tabular} Market Ratios \begin{tabular}{|l|} \hline Better \\ \hline Worse \\ \hline Worse \\ \hline Worse \\ \hline Better \\ \hline Better \\ \hline \end{tabular} Earnings per share Price per share P/E ratio \begin{tabular}{|l|l|} \hline 10.6% & 11.0% \\ \hline 31.05 & 44.03 \\ \hline \end{tabular} \begin{tabular}{|l|} \hline Better \\ \hline Better \\ \hline \end{tabular} \begin{tabular}{|l|} \hline Better \\ \hline Better \\ \hline Better \\ \hline Better \\ \hline Better \\ \hline \end{tabular} \begin{tabular}{|r|r|} \hline 38.7% & 40.5% \\ \hline 6.2% & 11.6% \\ \hline 3.4% & 7.6% \\ \hline 3.9% & 10.0% \\ \hline 7.9% & 19.5% \\ \hline \end{tabular} Better You also have the following balance sheet information as of December 31,2022 and 2021, respectively. EPS Dividends per share \begin{tabular}{|ll|ll|} \hline$ & 1.64 & $ & 2.87 \\ \hline$ & 1.15 & $ & 0.91 \\ \hline \end{tabular} \begin{tabular}{|l|c|c|c|c|} \hline Annual Balance Sheet (Values in \$ Thousands) & & \multicolumn{2}{c|}{ Common Size } \\ & 2022 & 2021 & 2022 & 2021 \\ \hline \end{tabular} Current assets Cash Receivables Inventories Other current assets Total current assets Noncurrent Assets Property, plant and equipment, gross Accumvlated depreciation and depletion Property, plant and equipment, net Other noncurrent assets Total noncurrent assets Total Assets \begin{tabular}{|r|rr|r|r|} \hline$ & 9,090 & $6,547 & 2.4% & 1.9% \\ \hline 21,163 & 19,549 & 5.7% & 5.8% \\ \hline 8,068 & 7,904 & 2.2% & 2.3% \\ \hline 1,831 & 1,681 & 0.5% & 0.5% \\ \hline$ & 40,152 & $35,681 & 10.7% & 10.5% \\ \hline \end{tabular} Liabilities and Stock Equity Current liabilities Accounts payable Short-term debt payable Other corrent liabilities Total current liabilities \begin{tabular}{|r|r|r|r|} \hline$204,960 & $187,519 & 54.7% & 55.3% \\ \hline 110,020 & 97,917 & 29.4% & 28.9% \\ \hline$314,980 & $285,436 & 84.1% & 84.2% \\ \hline 19,413 & 17,891 & 5.2% & 5.3% \\ \hline$19,413 & $17,891 & 5.2% & 5.3% \\ \hline$374,545 & $339,008 & 100.0% & 100.0% \\ \hline \end{tabular} \begin{tabular}{|r|r|r|r|} \hline$13,792 & $22,862 & 8.9% & 16.0% \\ \hline 4,093 & 3,703 & 2.6% & 2.6% \\ \hline 15,290 & 3,549 & 9.9% & 2.5% \\ \hline$33,175 & $30,114 & 21.5% & 21.0% \\ \hline \end{tabular} Lotal corrent liabilities Noncurrent liabilities Long-term debt payable Deferred income taxes Other noncurrent liabilities Total noncurrent liabilities Total Liabilities \begin{tabular}{|rr|rr|r|r|} \hline$ & 6,655 & $ & 7,099 & 4,3% & 5.0% \\ \hline & 16,484 & & 16,359 & 10.7% & 11.4% \\ \hline & 21,733 & & 16,441 & 14.1% & 11.5% \\ \hline$ & 44,872 & $ & 39,899 & 29.0% & 27.9% \\ \hline$ & 78,047 & $ & 70,013 & 50.5% & 48.9% \\ \hline \end{tabular} Total Stockholders' Equity Total Liabilities and Stock Equity \begin{tabular}{|r|rr|r|r|} \hline$76,458 & 73,161 & 49.5% & 51.1% \\ \hline$154,505 & $143,174 & 100.0% & 100.0% \\ \hline \end{tabular} Total common shares outstanding (million) \begin{tabular}{|l|l|} \hline 6.7 & 6.8 \\ \hline \end{tabular} \begin{tabular}{l} Liquidity Ratio \\ Current ratio \\ Quick ratio \\ Activity Ratios \\ \hline \end{tabular} Inventory turnover Average days of inventory Accounts receivable turnover Average collection period Fixed asset turnover Total asset turnover Debt Ratios Debt-to-asset ratio Times interest earned \begin{tabular}{|r|r|} \multicolumn{1}{|c|}{2022} & \multicolumn{1}{|c|}{2021} \\ \hline 1.21 & 1.18 \\ \hline 0.97 & 0.92 \\ \hline \end{tabular} Analysis Profitability Ratios Gross profit margin Operating profit margin Net profit margin Return on assets Return on equity \begin{tabular}{|r|r|} \hline 13.60 & 14.12 \\ \hline 16.46 & 15.39 \\ \hline 43.18 & 38.05 \\ \hline 57.98 & 53.56 \\ \hline 0.87 & 1.00 \\ \hline 0.48 & 0.55 \\ \hline \end{tabular} \begin{tabular}{|l|} \hline Better \\ \hline Worse \\ \hline \end{tabular} Market Ratios \begin{tabular}{|l|} \hline Better \\ \hline Worse \\ \hline Worse \\ \hline Worse \\ \hline Better \\ \hline Better \\ \hline \end{tabular} Earnings per share Price per share P/E ratio \begin{tabular}{|l|l|} \hline 10.6% & 11.0% \\ \hline 31.05 & 44.03 \\ \hline \end{tabular} \begin{tabular}{|l|} \hline Better \\ \hline Better \\ \hline \end{tabular} \begin{tabular}{|l|} \hline Better \\ \hline Better \\ \hline Better \\ \hline Better \\ \hline Better \\ \hline \end{tabular} \begin{tabular}{|r|r|} \hline 38.7% & 40.5% \\ \hline 6.2% & 11.6% \\ \hline 3.4% & 7.6% \\ \hline 3.9% & 10.0% \\ \hline 7.9% & 19.5% \\ \hline \end{tabular} Better
Step by Step Solution
There are 3 Steps involved in it

Get step-by-step solutions from verified subject matter experts