

Question: Spreadsheet Exercise: Chapter 3 The income statement and balance sheet are the primary reports that a furm constructs for use by management and for distribution
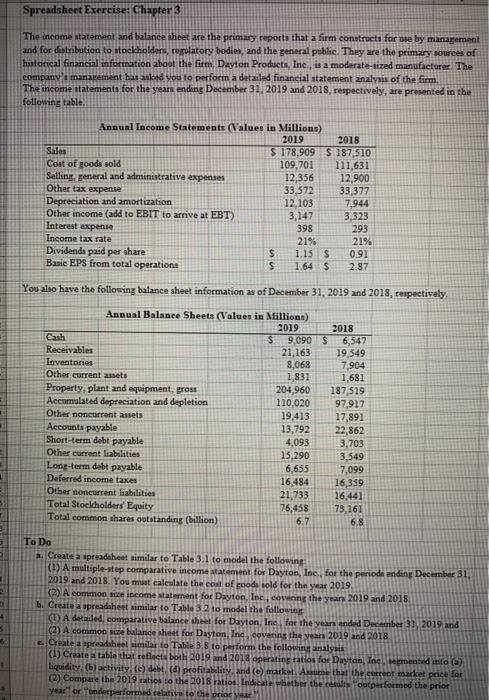
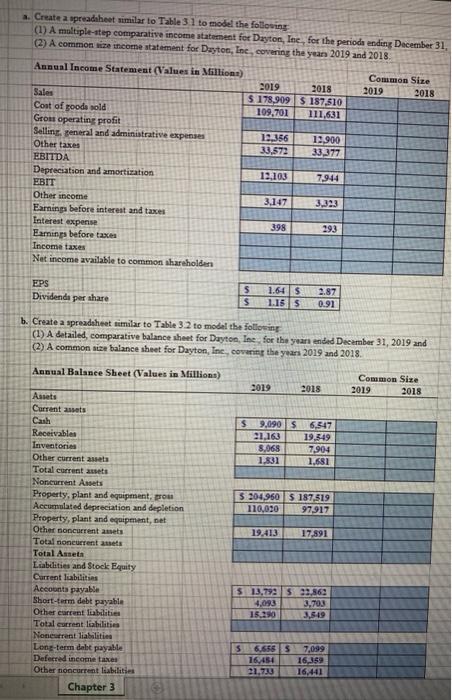
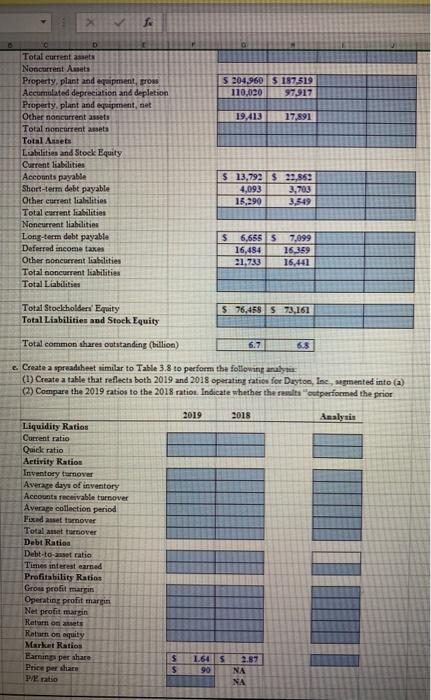
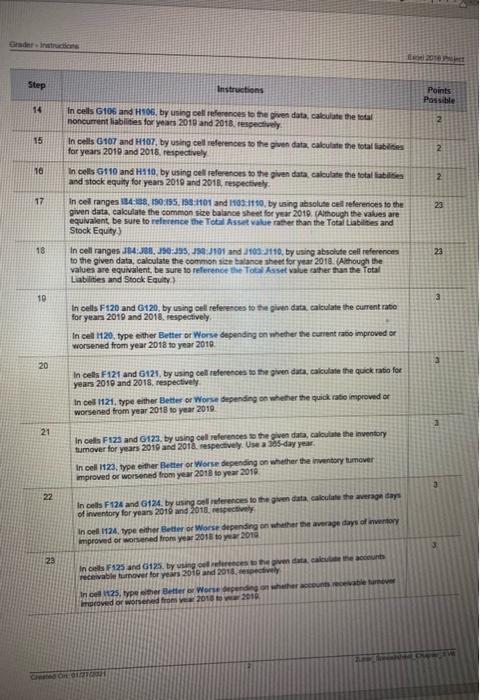
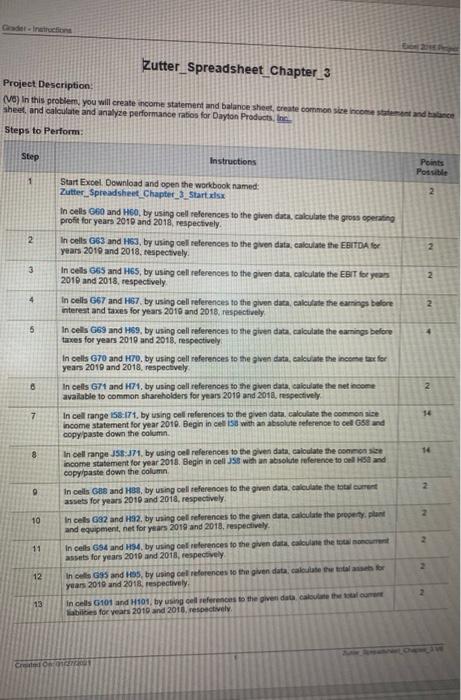
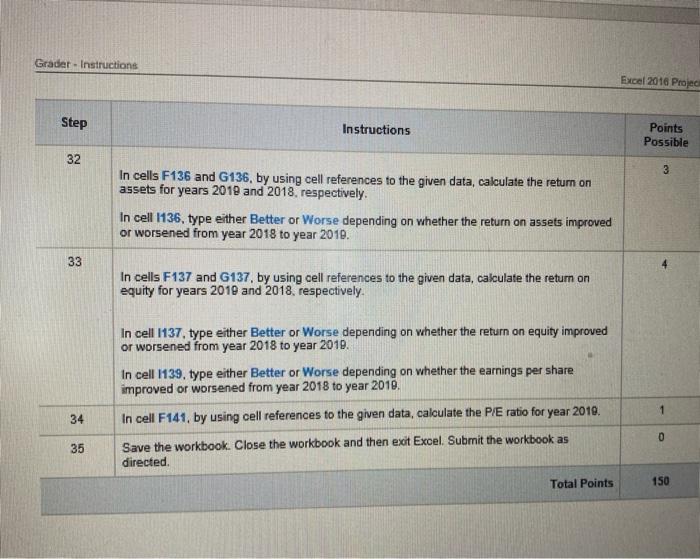
Spreadsheet Exercise: Chapter 3 The income statement and balance sheet are the primary reports that a furm constructs for use by management and for distribution to stockholders, regulatory bodies, and the general public. They are the primary sources of hastorical financial information about the firm Dayton Products, Inc. is a moderate-sized manufacturer. The company's manarement has asked you to perform a detailed financial statement analysis of the firm The income statements for the years ending December 31, 2019 and 2018, respectively, are presented in the following table Annual Income Statements (Values in Millions) 2019 2018 Sales $ 178,909 S 187,510 Cost of goods sold 109,701 111,631 Selling general and administrative expenses 12,356 12,900 Other tax expense 33,572 33,377 Depreciation and amortization 12,103 7,944 Other income (add to EBIT to arrive at EBT) 3,147 3,323 Interest expense 398 293 Income tax rate 21% 219 Dividends paid per share $ 1.15 $ 0.92 Basie EPS from total operations $ 1.64 $ 2.87 You also have the following balance sheet information as of December 31, 2019 and 2018, respectively, Annual Balance Sheets (Values in Millions) 2019 2018 Cash $ 9,090 $ 6,547 Receivables 21,163 19.549 Inventories 8,068 7.904 Other current assets 1,831 1,681 Property, plant and equipment, prost 204,960 187,519 Accumulated depreciation and depletion 110,020 97,917 Other noncurrent assets 19,413 17,891 Accounts payable 13,792 22,862 Short-term debt payable 4,093 3,703 Other current liabilities 15,290 3.549 Long-term debt payable 6,655 7,099 Deferred income taxes 16,484 16,359 Other noncurrent liabilities 21,733 16,441 Total Stockholders' Equity 76,458 73,161 Total common shares outstanding (billion) 6.7 6.8 3 5 4 3 3 To Do Create a spreadsheet similar to Table 3.1 to model the following: (1) A multiple-step comparative income statement for Dayton, Inc., for the periode ending December 31 2019 and 2018. You must calculate the cost of poods sold for the year 2019 (2) A common se income statement for Dayton, Inc., covering the year 2019 and 2018 b. Create a spreadsheet similar to Table 3.2 to model the following A detailed, comparative balance sheet for Dayton, Ine for the years andid December 31, 2019 and (2) A common se balance sheet for Dayton, Inc., covering the year 2019 and 2018 Create a spreadsheet similar to Table 3.8 to perform the following analysis (1) Create a table that reflects both 2019 and 2018 operatin tatios for Dayton Indemented into (3) liquidity. (b) activity (c) debt. () profitability, and (e) marketAsume that the current market price for (2) Compare the 2019 ratios to the 2018 ration: Indicate whether the rest outperformed the prior year or underperformed relative to the prior year 1 - Create a spreadsheet similar to Table 31 to mode the following (1) A multiple-step comparative income statement for Dayton, Ine, for the perioda ending December 31 (2) A common size income statement for Dayton, Inc., covering the year 2019 and 2018 Common Size 2019 2018 Annual Income Statement (Values in Millions) 2019 2018 Sales $ 178.909 S 187,510 Cost of roode sold 109,701 111,631 Grous operating profit Selling general and administrative expenses 12,356 12.900 Other takes 33,572 33,377 EBITDA Depreciation and amortization 13,103 7.944 EBIT Other income 3.147 3,323 Earning before interest and taxes Interest expense 398 293 Earnings before taxes Income taxes Net income available to common shareholder EPS Dividenda per share lu 5 $ 1.645 1.155 2.87 0.91 b. Create a spreadsheet similar to Table 3.2 to model the following (1) A detailed, comparative balance sheet for Dayton, Ine for the year ended December 31, 2019 and (2) A common size balance sheet for Dayton, Inc., covering the years 2019 and 2018 Annual Balance Sheet (Values in Millions) 2019 2018 Common Size 2019 2018 $ 9,090 S 6,347 21.163 19,34 8.068 7,904 1.831 1.681 $ 204,960 $ 187,519 110,000 97,917 19,413 17,891 Assets Current assets Cash Receivables Inventories Other current Total current sets Noncurrent Assets Property, plant and equipment, prou Accumulated depreciation and depletion Property, plant and equipment, bet Other boncurrent auets Total concurrent assets Total Asset Liabilities and Stock Equity Current liabilities Accounts payable Short-term debt payable Other current liabilities Total current liabilities Noncurrent liabilities Long-term debt payable Deferred income taxes Other noncurrent liabilities Chapter 3 $ 13,799 5 33.863 4,093 15.20 3,519 3,703 5 6.6585 7,099 16,451 16,359 21.70 16.441 b 5 204.960 5 187,519 110,020 97,917 19.413 17.891 Total current assets Noncurrent Aneta Property plant and equipment, gross Accumulated depreciation and depletion Property, plant and equipment, met Other noncurrent assets Total noncurrentes Total Assets Lubilities and Stock Equity Current liabilities Accounts payable Short-term debt payable Other current liabilities Total current liabilities Noneurrent liabilities Long-term debt payable Deferred income taxes Other boncurrent liabilities Total noncurrent liabilities Total Liabilities $ 13,792 $ 33,859 4,093 3,703 15,290 3,549 $ 6,6555 16,484 21,733 7,099 16.359 16,44 Total Stoelcholders' Equity Total Liabilities and Stock Equity $ 76,458 73,161 Total common shares outstanding (billion) 6.7 63 e. Create a spreadsheet similar to Table 3.8 to perform the following analysis (1) Create a table that reflects both 2019 and 2018 operating ration for Dayton, Inc., mented into (a) (2) Compare the 2019 ratios to the 2018 ratioIndicate whether the results outperformed the prior 2019 2018 Analysis Liquidity Ratios Current ratio Quick ratio Activity Ratios Inventory turnover Average days of inventory Accounts receivable turnover Average collection period Fixed asset tramover Total asset tover Debt Ration Debt-to-asset ratio Times interest earned Profitability Ratios Gross profit margin Operating profit marin Net profit margin Ratanon sets Ration equity Market Ratios Earning per share Price per share Prato $ $ 1645 2.87 90 NA NA Raub 1. tech ---- -11 Nine Gradering Step Instructions Points Possible 14 2 In cells G106 and H106. by using cell references to the given data, calculate the total noncurrent liabilities for years 2010 and 2018, respectively In cells G107 and H107, by using cell references to the given data, calculate the total Babies for years 2010 and 2015. respectively 15 2 16 In cells 6110 and H110, by using cell referenons to the given data, calculate the total abilities and stock equity for years 2010 and 2018, respectively 2 17 23 In cel ranges 184138. 10:195, 198101 and 103:1110, by using absolute cel references to the given data, calculate the common size balance sheet for year 2010. Although the values are equivalent, be sure to reference the Total Asset value rather than the Total Liabilities and Stock Equity In cell ranges 184388, 350:355, 358.J101 and 105:3110, by using absolute cell references to the given data, calculate the common si balance sheet for year 2018. (Although the values are equivalent, be sure to reference the Total Asset value cather than the Total Liabilities and Stock Equity 18 23 10 3 In cells F120 and G120, by using or references to the given data, calculate the current rato for years 2019 and 2018 respectively In cel 1120. type the Better or Worse depending on whether the current ratio improved or worsened from year 2018 to year 2010 3 20 In cells F121 and 6121, by using cell references to the given data, calculate the quick ratio for years 2010 and 2018, respectively In cel 1121. type either Better or Worse depending on whether the quick ratio improved or worsened from year 2018 to year 2019 21 In cells F123 and 123. by using cell references to the wen data, calculate the inventory tumover for years 2010 and 2012. respectively. Use a 5-day year In cell 1123, type either Better or Worse depending on whether the inventory tumover improved or worsened from year 2018 to year 2010 3 22 In cells F124 and G124. by using comences to the given data calculate the average days of inventory for years 2016 and 2018, respectively In oef 1124, type either Better or Worse depending on whether the average days of inventory improved or worsened from year 2015 to year 2010 23 Incl F125 and G125. by using recess the pe data care accounts receivable turnover for years 2010 and 2018. espectively In 125.typer Better Worse depending on whether acrecevable here proved or worsened from 2018 2018 COT Gde nation Zutter_Spreadsheet_Chapter_3 Project Description: (V) In this problem, you will create income statement and balance sheet create common size income standa sheet and calculate and analyze performance rates for Dayton Products, Steps to Perform Step Instructions Points Possible 1 2 Start Excel. Download and open the workbook named: Zutter_Spreadsheet_Chapter_3_Start.xlsx In cells 660 and HGO, by using cell references to the given data, calculate the gross operating profit for years 2010 and 2018 respectively In cells G63 and 153, by using cell references to the given data, calculate the EBITDA for years 2019 and 2018, respectively In cells 65 and H65, by using cell references to the given data, calculate the EBIT for years 2010 and 2018, respectively 2 2 3 2 4 2 5 4 8 2 7 14 8 In cells 667 and 1157 by using cell references to the given data, calculate the carings before interest and taxes for years 2010 and 2018 respectively In cells G63 and 169, by using cell references to the given data, calculate the earnings before taxes for years 2019 and 2018, respectively In cells G70 and HTO. by using cell references to the given data, calculate the income tax for years 2019 and 2018, respectively In cells 671 and H71, by using cell references to the given data, calculate the net income available to common shareholders for years 2010 and 2018 respectively In cell range 158.171. by using cell references to the given data, calculate the common se income statement for year 2010. Begin in cel 158 with an absolute reference to cel 58 and copy paste down the column In cell range J58.371, by using cel references to the given data, caloulate the common income statement for year 2018. Begin in cells with an absolute reference tools and copy paste down the column In cells GB8 and 133, by using cell references to the given data, calculate the total current assets for years 2010 and 2018, respectively In cels 692 and HS2, by using cell references to the given data, calculate the property.pl and equipment, net for years 2019 and 2018, respectively In cells 694 and H34, by using cel references to the given data, calculate the colour assets for years 2010 and 2018, respectively Ins GS and is by using ce references to the given data, calculate the total for years 2010 and 2018, respectively in cells 101 and H101, by using cell references to the given data come there abies for years 2010 and 2010, respectively 2 2 10 11 12 2 13 CON Gradet - Instructions Excel 2016 Proje Step Instructions Points Possible 32 3 In cells F136 and G136, by using cell references to the given data, calculate the return on assets for years 2019 and 2018, respectively In cell 1136, type either Better or Worse depending on whether the return on assets improved or worsened from year 2018 to year 2010. 33 In cells F137 and G137, by using cell references to the given data, calculate the return on equity for years 2019 and 2018, respectively. In cell 1137, type either Better or Worse depending on whether the return on equity improved or worsened from year 2018 to year 2010. In cell 1139, type either Better or Worse depending on whether the earnings per share improved or worsened from year 2018 to year 2018. In cell F141, by using cell references to the given data, calculate the P/E ratio for year 2010 34 0 35 Save the workbook. Close the workbook and then exit Excel. Submit the workbook as directed Total Points 150
Step by Step Solution
There are 3 Steps involved in it

Get step-by-step solutions from verified subject matter experts