

Question: Please make a 2-way data table (using the attached excel data) which calculates the value per share that varies the terminal growth rate and WACC.
Please make a 2-way data table (using the attached excel data) which calculates the value per share that varies the terminal growth rate and WACC. Please explain the steps on excel for how to make this data table (i do not know how to make a 2-way data table).
Additional info that may be helpful: Sales will grow by 2% each year All recurring operating expenses and depreciation are a percent of sales based on 2019 levels. The tax rate is 21%.; After year 3 of the forecast, free cash flows will grow by 2%. Assume that working capital is a constant percent of sales based on 2019 levels and capital spending equals depreciation each year. Assume that they will use 50% debt financing and use WACC = 7.40%. There are 40 million shares outstanding.
Here is the excel data from which you will make the table:
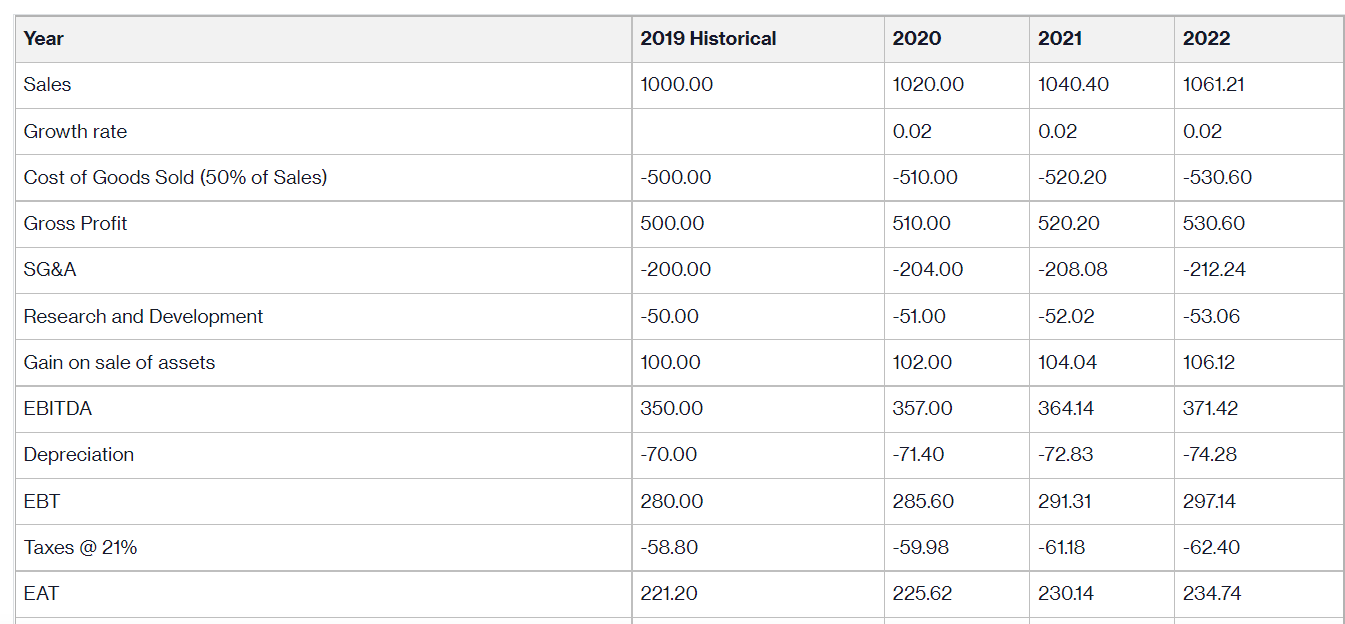
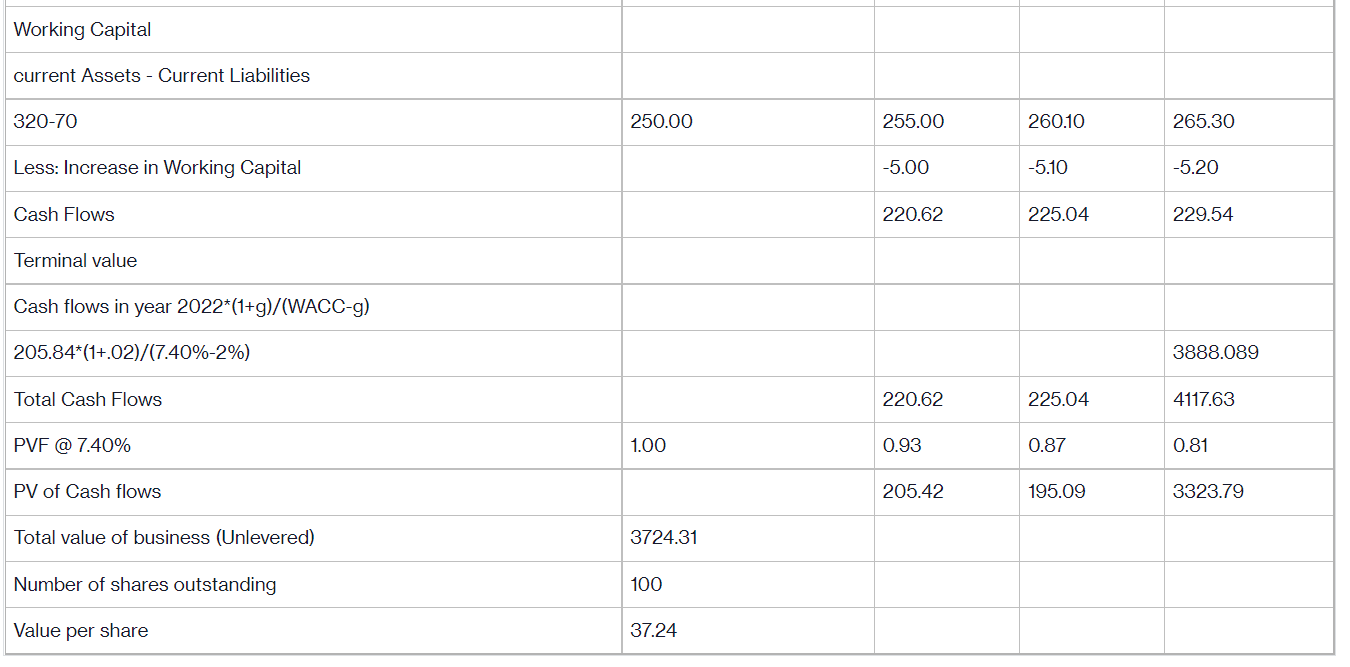
Year Sales Growth rate Cost of Goods Sold (50% of Sales) Gross Profit SG&A Research and Development Gain on sale of assets EBITDA Depreciation EBT Taxes @ 21% EAT 2019 Historical 1000.00 -500.00 500.00 -200.00 -50.00 100.00 350.00 -70.00 280.00 -58.80 221.20 2020 1020.00 0.02 -510.00 510.00 -204.00 -51.00 102.00 357.00 -71.40 285.60 -59.98 225.62 2021 1040.40 0.02 -520.20 520.20 -208.08 -52.02 104.04 364.14 -72.83 291.31 -61.18 230.14 2022 1061.21 0.02 -530.60 530.60 -212.24 -53.06 106.12 371.42 -74.28 297.14 -62.40 234.74 Working Capital current Assets - Current Liabilities 320-70 Less: Increase in Working Capital Cash Flows Terminal value Cash flows in year 2022*(1+g)/(WACC-g) 205.84*(1+.02)/(7.40%-2%) Total Cash Flows PVF @ 7.40% PV of Cash flows Total value of business (Unlevered) Number of shares outstanding Value per share 250.00 1.00 3724.31 100 37.24 255.00 -5.00 220.62 220.62 0.93 205.42 260.10 -5.10 225.04 225.04 0.87 195.09 265.30 -5.20 229.54 3888.089 4117.63 0.81 3323.79 Year Sales Growth rate Cost of Goods Sold (50% of Sales) Gross Profit SG&A Research and Development Gain on sale of assets EBITDA Depreciation EBT Taxes @ 21% EAT 2019 Historical 1000.00 -500.00 500.00 -200.00 -50.00 100.00 350.00 -70.00 280.00 -58.80 221.20 2020 1020.00 0.02 -510.00 510.00 -204.00 -51.00 102.00 357.00 -71.40 285.60 -59.98 225.62 2021 1040.40 0.02 -520.20 520.20 -208.08 -52.02 104.04 364.14 -72.83 291.31 -61.18 230.14 2022 1061.21 0.02 -530.60 530.60 -212.24 -53.06 106.12 371.42 -74.28 297.14 -62.40 234.74 Working Capital current Assets - Current Liabilities 320-70 Less: Increase in Working Capital Cash Flows Terminal value Cash flows in year 2022*(1+g)/(WACC-g) 205.84*(1+.02)/(7.40%-2%) Total Cash Flows PVF @ 7.40% PV of Cash flows Total value of business (Unlevered) Number of shares outstanding Value per share 250.00 1.00 3724.31 100 37.24 255.00 -5.00 220.62 220.62 0.93 205.42 260.10 -5.10 225.04 225.04 0.87 195.09 265.30 -5.20 229.54 3888.089 4117.63 0.81 3323.79
Step by Step Solution
There are 3 Steps involved in it

Get step-by-step solutions from verified subject matter experts