

Question: Please make the graphs and their interpretations using jamovi Q1: Create separate scatterplots for the weekly prices of gold (XAU), KOZAA, and KOZAL stocks. Use
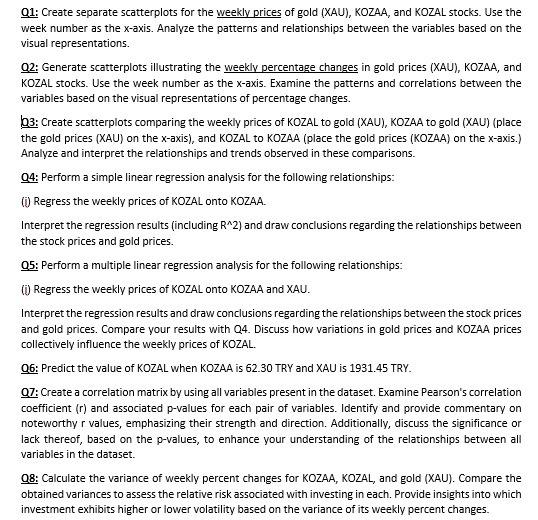
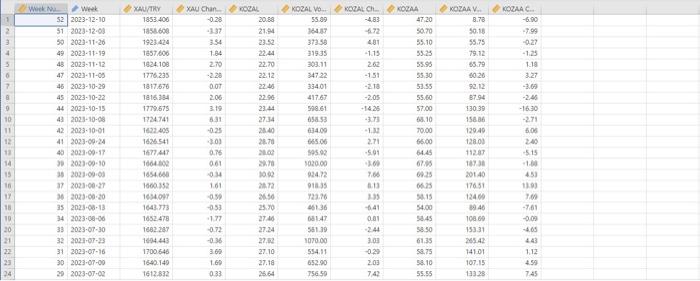
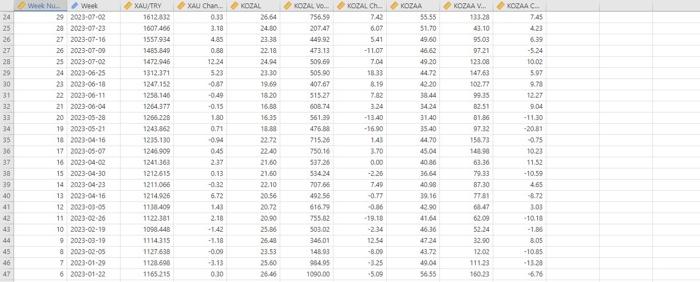
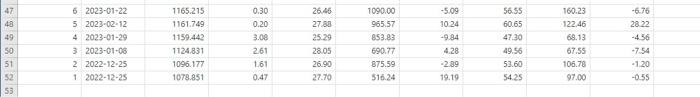
Q1: Create separate scatterplots for the weekly prices of gold (XAU), KOZAA, and KOZAL stocks. Use the week number as the x-axis. Analyze the patterns and relationships between the variables based on the visual representations. Q2: Generate scatterplots illustrating the weekly percentage changes in gold prices (XAU), KOZAA, and KOZAL stocks. Use the week number as the x-axis. Examine the patterns and correlations between the variables based on the visual representations of percentage changes. Q3: Create scatterplots comparing the weekly prices of KOZAL to gold (XAU), KOZAA to gold (XAU) (place the gold prices (XAU) on the X-axis), and KOZAL to KOZAA (place the gold prices (KOZAA) on the X-axis.) Analyze and interpret the relationships and trends observed in these comparisons. Q4: Perform a simple linear regression analysis for the following relationships: (i) Regress the weekly prices of KOZAL onto KOZAA. Interpret the regression results (including R 2) and draw conclusions regarding the relationships between the stock prices and gold prices. Q5: Perform a multiple linear regression analysis for the following relationships: (i) Regress the weekly prices of KOZAL onto KOZAA and XAU. Interpret the regression results and draw conclusions regarding the relationships between the stock prices and gold prices. Compare your results with Q4. Discuss how variations in gold prices and KOZAA prices collectively influence the weekly prices of KOZAL. Q6: Predict the value of KOZAL when KOZAA is 62.30 TRY and XAU is 1931.45 TRY. Q7: Create a correlation matrix by using all variables present in the dataset. Examine Pearson's correlation coefficient ( r ) and associated p-values for each pair of variables. Identify and provide commentary on noteworthy r values, emphasizing their strength and direction. Additionally, discuss the significance or lack thereof, based on the p-values, to enhance your understanding of the relationships between all variables in the dataset. Q8: Calculate the variance of weekly percent changes for KOZAA, KOZAL, and gold (XAU). Compare the obtained variances to assess the relative risk associated with investing in each. Provide insights into which investment exhibits higher or lower volatility based on the variance of its weekly percent changes. \begin{tabular}{|c|c|c|c|c|c|c|c|c|c|c|} \hline & Whent Nu & o week & XADJTRY & 6 xaychan. & 0KOZAL & rognive. & 8 woen ch & VOZAA & KoZaAV. & 10 nozarc. \\ \hline 24 & 29 & 2023:0702 & 1612432 & 0.33 & 2664 & 75659 & 7.42 & 55.55 & & 7.45 \\ \hline 25 & zb & 20230723 & 167,406 & 3.18 & 24.60 & 207.47 & 607 & 51,70 & 49,10 & 4.23 \\ \hline 26 & 27. & 20230t16 & 1557.934 & 4.85 & 2336 & 44992 & 5.41 & 49.60 & 95.03 & 6.39 \\ \hline 27 & 26 & 20230700 & 1465.849 & 0.89 & 2218 & 473.13 & 11.0 & 46.62 & 9721 & -5.24 \\ \hline 28 & 25 & 20230702 & 1472.946 & 12.24 & 24.94 & 30260 & 704 & 49.20 & 123.00 & 10,02 \\ \hline 29 & 24 & 20236625 & 1312.371 & 523 & 2330 & 50500 & 1833 & 44.72 & 147.63 & 5.07 \\ \hline 30 & 23 & 20236618 & 1247.152 & -017 & 19.69 & 407.67 & 8.19 & 4220 & 10277 & \\ \hline 31 & 22 & 20230011 & 1250.140 & -0.49 & 1820 & 515.27 & 782 & 38.44 & 99.35 & 12.27 \\ \hline 32 & 21 & 20230004 & 1264.377 & -0.15 & 16.53 & 60874 & 324 & 34.24 & 82.51 & 904 \\ \hline 33 & 20 & 20230528 & 1265.228 & 180 & 1635 & 561.39 & -13.40 & 31.40 & 8186 & 11,30 \\ \hline 34 & 19 & 20230521 & 1243.852 & 0.71 & 18.89 & 47683 & -1690 & 35.40 & 97.32 & -2039 \\ \hline 35 & 18 & 20230416 & 1215.130 & -0.95 & 2272 & 71526 & 1.43 & 44. 20 & tsan & 75 \\ \hline 36 & 17 & 20230507 & 1245909 & 0.45 & 224 & 73016 & 3.70 & 45.04 & tase & 1023 \\ \hline 37 & 16 & 20230402 & 1241363 & 237 & 21,00 & 537.26 & 0.00 & 4080 & 63.36 & 11,52 \\ \hline 38 & 15 & 20236430 & 1212615 & 0.13 & 21.60 & 53424 & -226 & 3664 & 79.33 & -1059 \\ \hline 39 & 14 & 20230423 & 1211.066 & -0.32 & 22.10 & 707.66 & 7.4D & 40.96 & 87,30 & 4.65 \\ \hline 40 & 13 & 20230416 & 1214.926 & 6.72 & 2056 & 49256 & -0.77 & 39.16 & 77.31 & 872 \\ \hline 41 & 12 & 20230305 & 1130.409 & 1,43 & 20.72 & 61679 & -0.86 & 42.90 & 64.47 & 103 \\ \hline de & 11 & 20250226 & 1122.361 & 2,18 & 2990 & 755.82 & -19.48 & 41.64 & 6209 & -1018 \\ \hline 4 & 10 & 20230219 & 1056.448 & +1.42 & 25.86 & 503.02 & .234 & 46.36 & 52.24 & 1.8d \\ \hline 44 & 9 & 20230319 & 1114315 & +1.18 & 25.43 & 34501 & 1234 & 4724 & 32.50 & \\ \hline 45 & 8 & 20230205 & 1127638 & -0.00 & 23.53 & 148.03 & -8.00 & 43.72 & 12.02 & -10.55 \\ \hline 46 & 7 & 20230129 & 1128690 & -3.13 & 25.60 & 934.95 & .125 & 49.04 & 111.23 & -1323 \\ \hline a? & 6 & 26230122 & 1165.215 & 0.10 & 2645 & 109000 & .509 & 5655 & 160.23 & 6.76 \\ \hline \end{tabular}
Step by Step Solution
There are 3 Steps involved in it

Get step-by-step solutions from verified subject matter experts