

Question: . please make the graphs with a table with their table points for question #1 so I can know what points are plotted in each
.
please make the graphs with a table with their table points for question #1 so I can know what points are plotted in each graph submit each graph separately with everything question 1 requires please do step by step if you can
for #2 please do the correlation matrix for the six variables Make sure you list the variables that have strong demand PLEASE EXPLAIN THE FINDINGS AND HOW YOU GOT THE ANSWER
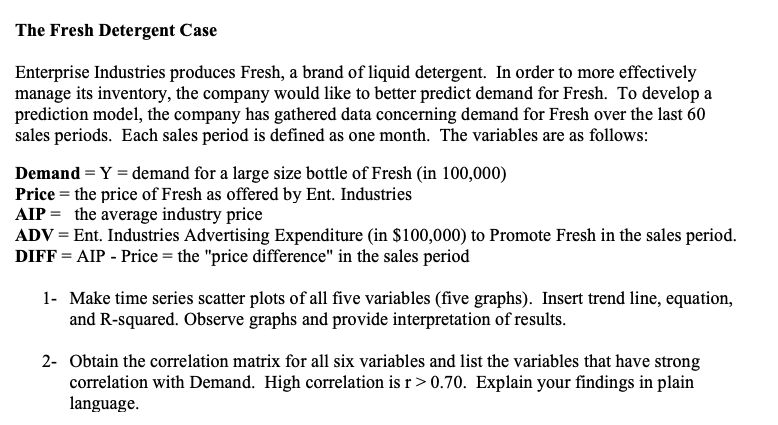
The Fresh Detergent Case Enterprise Industries produces Fresh, a brand of liquid detergent. In order to more effectively manage its inventory, the company would like to better predict demand for Fresh. To develop a prediction model, the company has gathered data concerning demand for Fresh over the last 60 sales periods. Each sales period is defined as one month. The variables are as follows: Demand = Y = demand for a large size bottle of Fresh (in 100,000) Price = the price of Fresh as offered by Ent. Industries AIP = the average industry price ADV = Ent. Industries Advertising Expenditure (in $100,000) to Promote Fresh in the sales period. DIFF = AIP - Price = the "price difference" in the sales period 1- Make time series scatter plots of all five variables (five graphs). Insert trend line, equation, and R-squared. Observe graphs and provide interpretation of results. 2- Obtain the correlation matrix for all six variables and list the variables that have strong correlation with Demand. High correlation is r >0.70. Explain your findings in plain language
Step by Step Solution
There are 3 Steps involved in it
1 Expert Approved Answer
Step: 1 Unlock

Question Has Been Solved by an Expert!
Get step-by-step solutions from verified subject matter experts
Step: 2 Unlock
Step: 3 Unlock