

Question: Please need answer asap and the graph and the data of the question is attached below Market Share 0.248 0.256 0.267 0.253 0.267 0.267 0.265
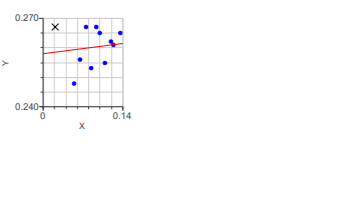
Please need answer asap and the graph and the data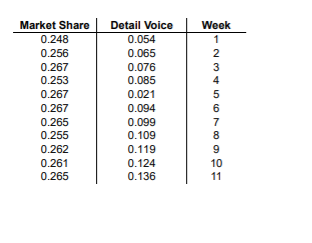 of the question is attached below
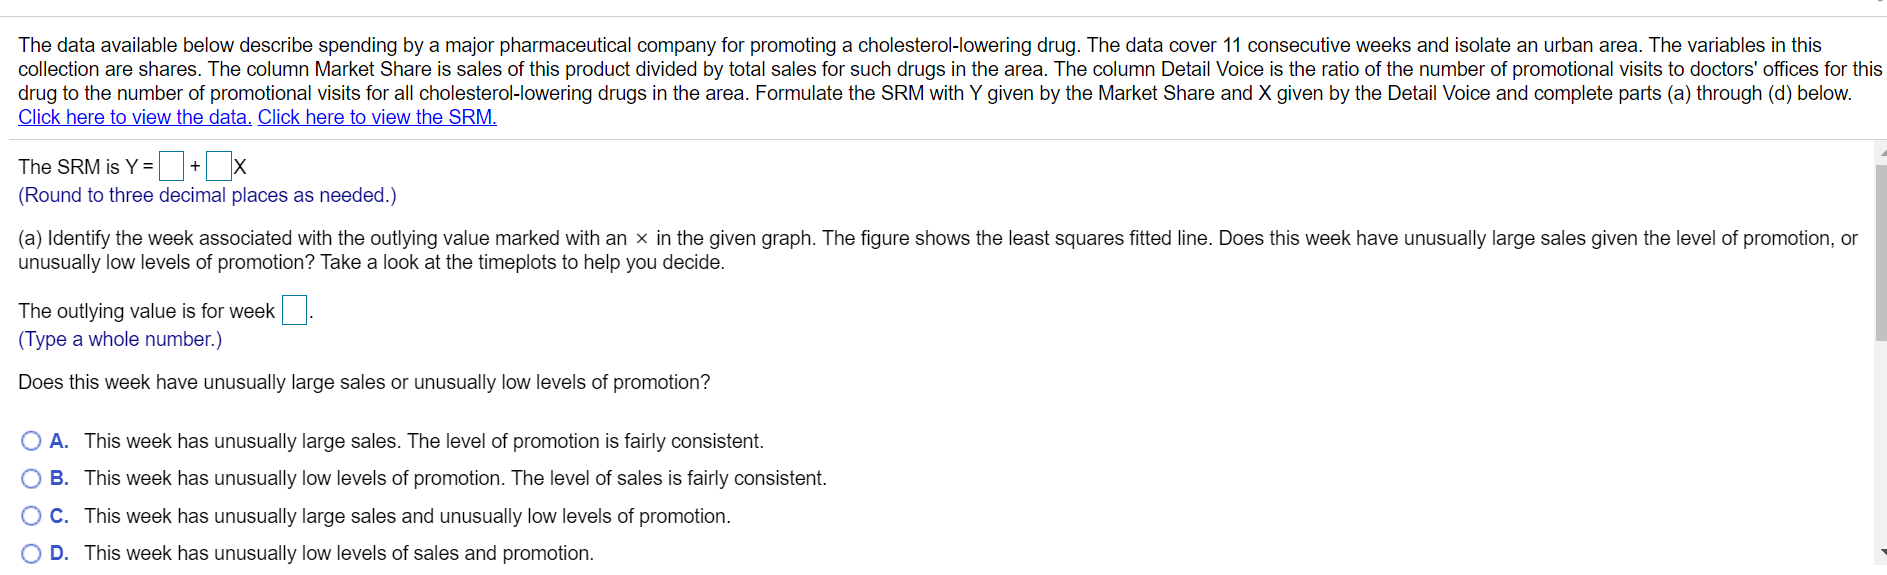
Step by Step Solution
There are 3 Steps involved in it
1 Expert Approved Answer
Step: 1 Unlock

Question Has Been Solved by an Expert!
Get step-by-step solutions from verified subject matter experts
Step: 2 Unlock
Step: 3 Unlock