

Question: Please need MATLAB script 1. (3 points) Below you will find three different sets of data (a, b, and c). For each data set determine
Please need MATLAB script
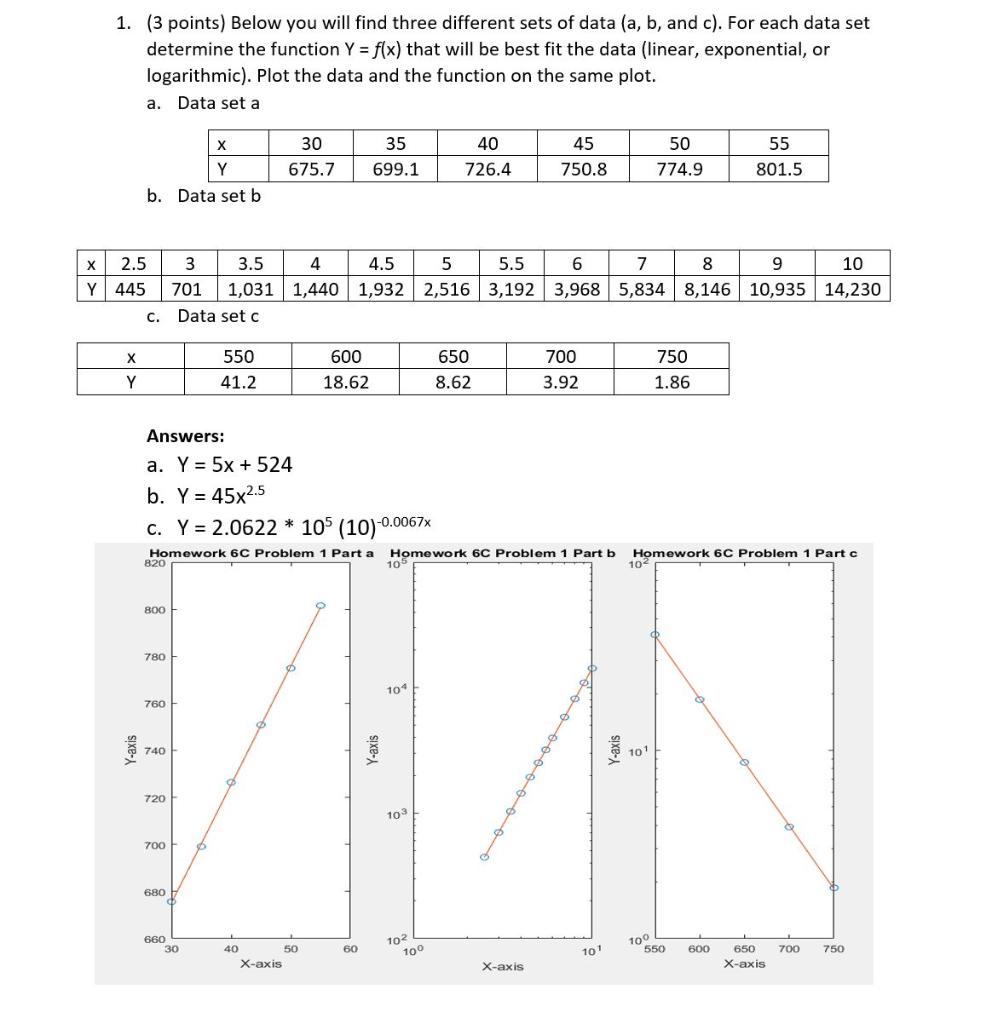
1. (3 points) Below you will find three different sets of data (a, b, and c). For each data set determine the function Y = f(x) that will be best fit the data (linear, exponential, or logarithmic). Plot the data and the function on the same plot. a. Data set a 50 x Y b. Data set b 30 675.7 35 699.1 40 726.4 45 750.8 55 801.5 774.9 X Y 2.5 445 3 3.5 4 701 1,031 1,440 Data set c 4.5 5 5.5 6 7 8 9 10 1,932 2,516 3,192 3,968 5,834 8,146 10,935 14,230 c. 550 650 X Y 600 18.62 700 3.92 750 1.86 41.2 8.62 Answers: a. Y = 5x + 524 b. Y = 45x2.5 c. Y = 2.0622 * 105 (10)-0. -0.0067x Homework 6C Problem 1 Part a Homework 6C Problem 1 Part b 820 Homework 6C Problem 1 Part c 102 800 780 104 760 Y-axis 740 Y-axis 101 720 103 700 680 660 30 100 60 TO2 100 101 550 600 700 40 50 X-axis 750 650 X-axis X-axis
Step by Step Solution
There are 3 Steps involved in it

Get step-by-step solutions from verified subject matter experts