

Question: Please plot any graphs in MiniTAB if so X1 x2 y -1 -1 -1 Q11: An experiment was run to study the effect of two
Please plot any graphs in MiniTAB if so
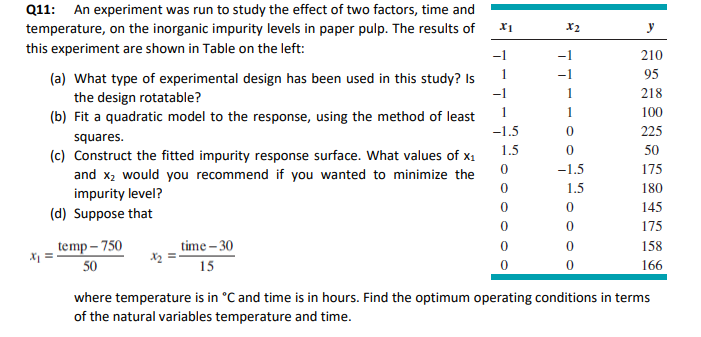
X1 x2 y -1 -1 -1 Q11: An experiment was run to study the effect of two factors, time and temperature, on the inorganic impurity levels in paper pulp. The results of this experiment are shown in Table on the left: (a) What type of experimental design has been used in this study? Is the design rotatable? (b) Fit a quadratic model to the response, using the method of least squares. (c) Construct the fitted impurity response surface. What values of Xi and xz would you recommend if you wanted to minimize the impurity level? (d) Suppose that -1.5 1.5 0 0 0 0 1 0 0 -1.5 1.5 0 0 0 0 210 95 218 100 225 50 175 180 145 175 158 166 temp 750 x = 50 time-30 15 0 0 where temperature is in C and time is in hours. Find the optimum operating conditions in terms of the natural variables temperature and time. X1 x2 y -1 -1 -1 Q11: An experiment was run to study the effect of two factors, time and temperature, on the inorganic impurity levels in paper pulp. The results of this experiment are shown in Table on the left: (a) What type of experimental design has been used in this study? Is the design rotatable? (b) Fit a quadratic model to the response, using the method of least squares. (c) Construct the fitted impurity response surface. What values of Xi and xz would you recommend if you wanted to minimize the impurity level? (d) Suppose that -1.5 1.5 0 0 0 0 1 0 0 -1.5 1.5 0 0 0 0 210 95 218 100 225 50 175 180 145 175 158 166 temp 750 x = 50 time-30 15 0 0 where temperature is in C and time is in hours. Find the optimum operating conditions in terms of the natural variables temperature and time
Step by Step Solution
There are 3 Steps involved in it

Get step-by-step solutions from verified subject matter experts