

Question: please plot the data b. The data shown in the table below were obtained from a tension test on an aluminium alloy specimen 1.58 241
please plot the data 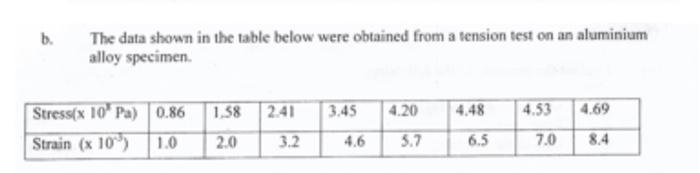
b. The data shown in the table below were obtained from a tension test on an aluminium alloy specimen 1.58 241 3.45 4.20 4.48 4.53 4.69 Stress(x 10' Pa) 0.86 Strain (x 10 1.0 2.0 3.2 4.6 5.7 6.5 7.0 8.4 Step by Step Solution
There are 3 Steps involved in it
1 Expert Approved Answer
Step: 1 Unlock

Question Has Been Solved by an Expert!
Get step-by-step solutions from verified subject matter experts
Step: 2 Unlock
Step: 3 Unlock