

Question: Please post excel sheets with formulas. Thank You. Q1. Construet a p-chart ABC company ships thousands of orders each day from seven national distribution centers.
Please post excel sheets with formulas. Thank You. 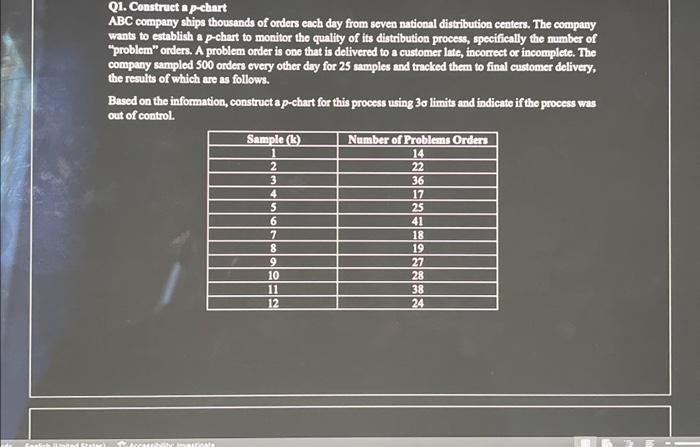
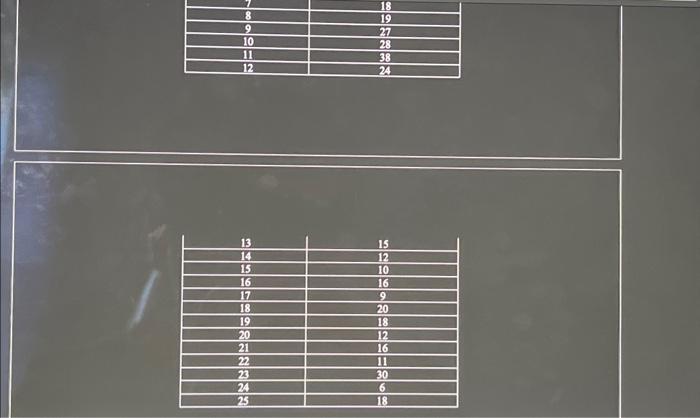
Q1. Construet a p-chart ABC company ships thousands of orders each day from seven national distribution centers. The company wants to establish a p-chart to monitor the quality of its distribution process, specifically the number of "problem" orders. A problem order is one that is delivered to a customer late, inconect or incomplete. The company sampled 500 ordens every other day for 25 amples and tracked them to final customer delivery, the results of which are as follows. Based on the information, construct a p-chart for this process using 3d limits and indicate if the process was cut of control
Step by Step Solution
There are 3 Steps involved in it
1 Expert Approved Answer
Step: 1 Unlock

Question Has Been Solved by an Expert!
Get step-by-step solutions from verified subject matter experts
Step: 2 Unlock
Step: 3 Unlock