

Question: Please provide all formulas/steps if possible Refer to the table Factors for Computing Control Chart Limits (3 sigma) LOADING... for this problem. Your supervisor, Lisa
Please provide all formulas/steps if possible
Refer to the table Factors for Computing Control Chart Limits (3 sigma)
LOADING...
for this problem.
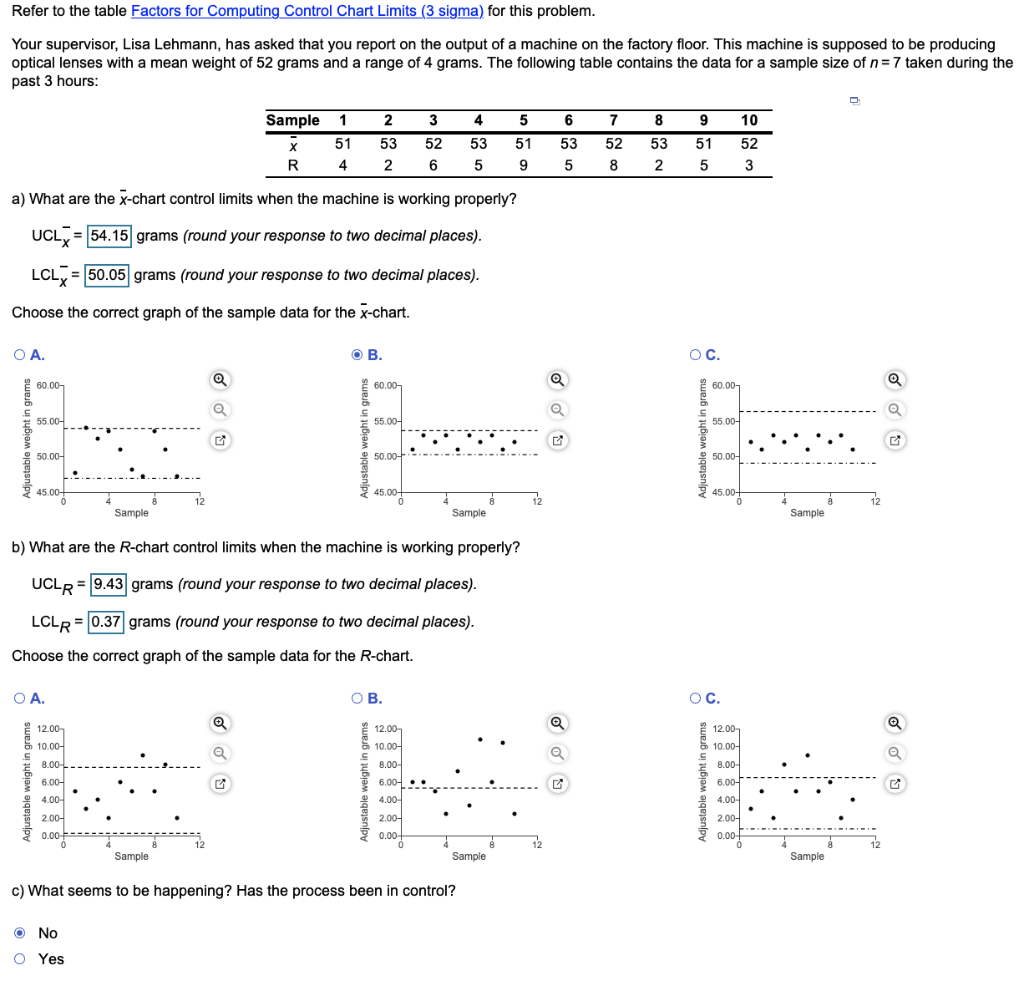
Your supervisor, Lisa Lehmann, has asked that you report on the output of a machine on the factory floor. This machine is supposed to be producing optical lenses with a mean weight of
52
grams and a range of
4
grams. The following table contains the data for a sample size of
n=7
taken during the past 3 hours:
| Sample | 1 | 2 | 3 | 4 | 5 | 6 | 7 | 8 | 9 | 10 |
| x | 51 | 53 | 52 | 53 | 51 | 53 | 52 | 53 | 51 | 52 |
| R | 4 | 2 | 6 | 5 | 9 | 5 | 8 | 2 | 5 | 3 |
a) What are the
x-chart
control limits when the machine is working properly?
UCLx=54.1554.15
grams (round your response to two decimal places).
LCLx=50.0550.05
grams (round your response to two decimal places).
Choose the correct graph of the sample data for the
x-chart.
A.
0481245.0050.0055.0060.00SampleAdjustable weight in grams
A coordinate system, with the horizontal axis, labeled Sample, ranges from 0 to 12 with ticks in increments of 4. The vertical axis, labeled Adjustable weight in grams, ranges from 45 to 60 with ticks in increments of 5. Two dashed horizontal lines and 10 points are plotted on the graph. One of the horizontal line cuts the vertical axis at 54 and other horizontal line cuts the vertical axis at 47. The points are plotted at (1,47.66), (2,54.06), (3,52.52), (4,53.53), (5,53), (6,48.18), (7,47.27), (8,53.53), (9,51), and (10,47.27).
B.
0481245.0050.0055.0060.00SampleAdjustable weight in grams
A coordinate system, with the horizontal axis, labeled Sample, ranges from 0 to 12 with ticks in increments of 4. The vertical axis, labeled Adjustable weight in grams, ranges from 45 to 60 with ticks in increments of 5. Two dashed horizontal lines and 10 points are plotted on the graph. One of the horizontal line cuts the vertical axis at 53.68 and other horizontal line cuts the vertical axis at 50.32. The points are plotted at (1,51), (2,53), (3,52), (4,53), (5,51), (6,53), (7,52), (8,53), (9,51), and (10,52).
C.
0481245.0050.0055.0060.00SampleAdjustable weight in grams
A coordinate system, with the horizontal axis, labeled Sample, ranges from 0 to 12 with ticks in increments of 4. The vertical axis, labeled Adjustable weight in grams, ranges from 45 to 60 with ticks in increments of 5. Two dashed horizontal lines and 10 points are plotted on the graph. One of the horizontal line cuts the vertical axis at 56.36 and other horizontal line cuts the vertical axis at 49.12. The points are plotted at (1,52), (2,51), (3,53), (4,52), (5,53), (6,51), (7,53), (8,52), (9,53), and (10,51).
b) What are the
R-chart
control limits when the machine is working properly?
UCLR=9.439.43
grams (round your response to two decimal places).
LCLR=0.370.37
grams (round your response to two decimal places).
Choose the correct graph of the sample data for the
R-chart.
A.
048120.002.004.006.008.0010.0012.00SampleAdjustable weight in grams
A coordinate system, with the horizontal axis, labeled Sample, ranges from 0 to 12 with ticks in increments of 4. The vertical axis, labeled Adjustable weight in grams, ranges from 0.00 to 12 with ticks in increments of 2. Two dashed horizontal lines and 10 points are plotted on the graph. One of the horizontal line cuts the vertical axis at 7.70 and other horizontal line cuts the vertical axis at 0.30. The points are plotted at (1,5), (2,3), (3,4), (4,2), (5,6), (6,5), (7,9), (8,5), (9,8), and (10,2).
B.
048120.002.004.006.008.0010.0012.00SampleAdjustable weight in grams
A coordinate system, with the horizontal axis, labeled Sample, ranges from 0 to 12 with ticks in increments of 4. The vertical axis, labeled Adjustable weight in grams, ranges from 0.00 to 12 with ticks in increments of 2. One dashed horizontal line and 10 points are plotted on the graph. The horizontal line cuts the vertical axis at 5.38. The points are plotted at (1,6.00), (2,6.00), (3,5.00), (4,2.40), (5,7.20), (6,3.33), (7,10.80), (8,6.00), (9,10.40), and (10,2.40).
C.
048120.002.004.006.008.0010.0012.00SampleAdjustable weight in grams
A coordinate system, with the horizontal axis, labeled Sample, ranges from 0 to 12 with ticks in increments of 4. The vertical axis, labeled Adjustable weight in grams, ranges from 0.00 to 12 with ticks in increments of 2. Two dashed horizontal lines and 10 points are plotted on the graph. One of the horizontal line cuts the vertical axis at 6.55 and other horizontal line cuts the vertical axis at 0.8. The points are plotted at (1,3), (2,5), (3,2), (4,8), (5,5), (6,9), (7,5), (8,6), (9,2), and (10,4).
c) What seems to be happening? Has the process been in control?
No
Refer to the table Factors for Computing Control Chart Limits (3 sigma) for this problem. Your supervisor, Lisa Lehmann, has asked that you report on the output of a machine on the factory floor. This machine is supposed to be producing optical lenses with a mean weight of 52 grams and a range of 4 grams. The following table contains the data for a sample size of n= 7 taken during the past 3 hours: 3 4 5 10 Sample 1 2 51 53 R 4 2 51 52 6 53 5 5 6 53 5 5 7 52 8 8 53 2 9 51 5 52 3 9 a) What are the x-chart control limits when the machine is working properly? UCLT = 54.15 grams (round your response to two decimal places). = LCL = 50.05 grams (round your response to two decimal places). Choose the correct graph of the sample data for the x-chart. . . OC. 60.00 a 60.00 60.00 55.00- 55.00 55.00- Adjustable weight in grams 50.00 50.00 50.00 45.00 0 45.00+ $ 12 12 45.00 0 Sample Sample Sample b) What are the R-chart control limits when the machine is working properly? UCLR = 9.43 grams (round your response to two decimal places). LCLR = 0.37 grams (round your response to two decimal places). Choose the correct graph of the sample data for the R-chart. OA. . B. OC. 12.00 10.00- 12.00 10.00- 8.00 2 12.00 10.00- 8.00 6.00 a 8.00-4 6.00- 6.00- 4.00 Adjustable weight in grams Adjustable weight in 4.00 4.00- 200- 2.00- 2.00- 0.00-F 0 0.00! 0.00-1 0 12 12 Sample 4 Sample Sample c) What seems to be happening? Has the process been in control? No O YesStep by Step Solution
There are 3 Steps involved in it

Get step-by-step solutions from verified subject matter experts