

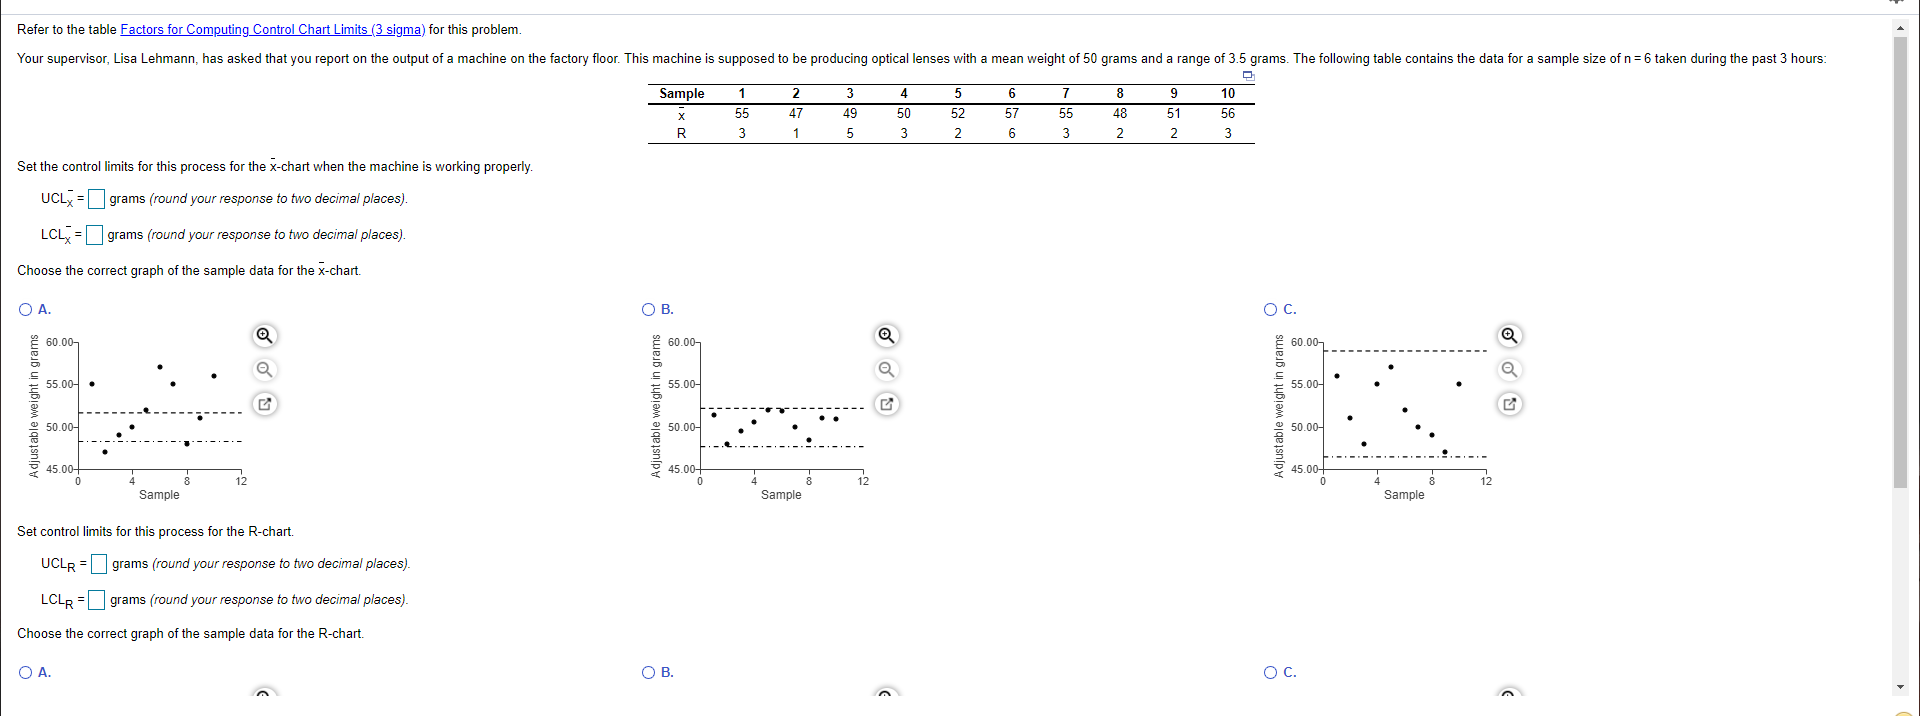
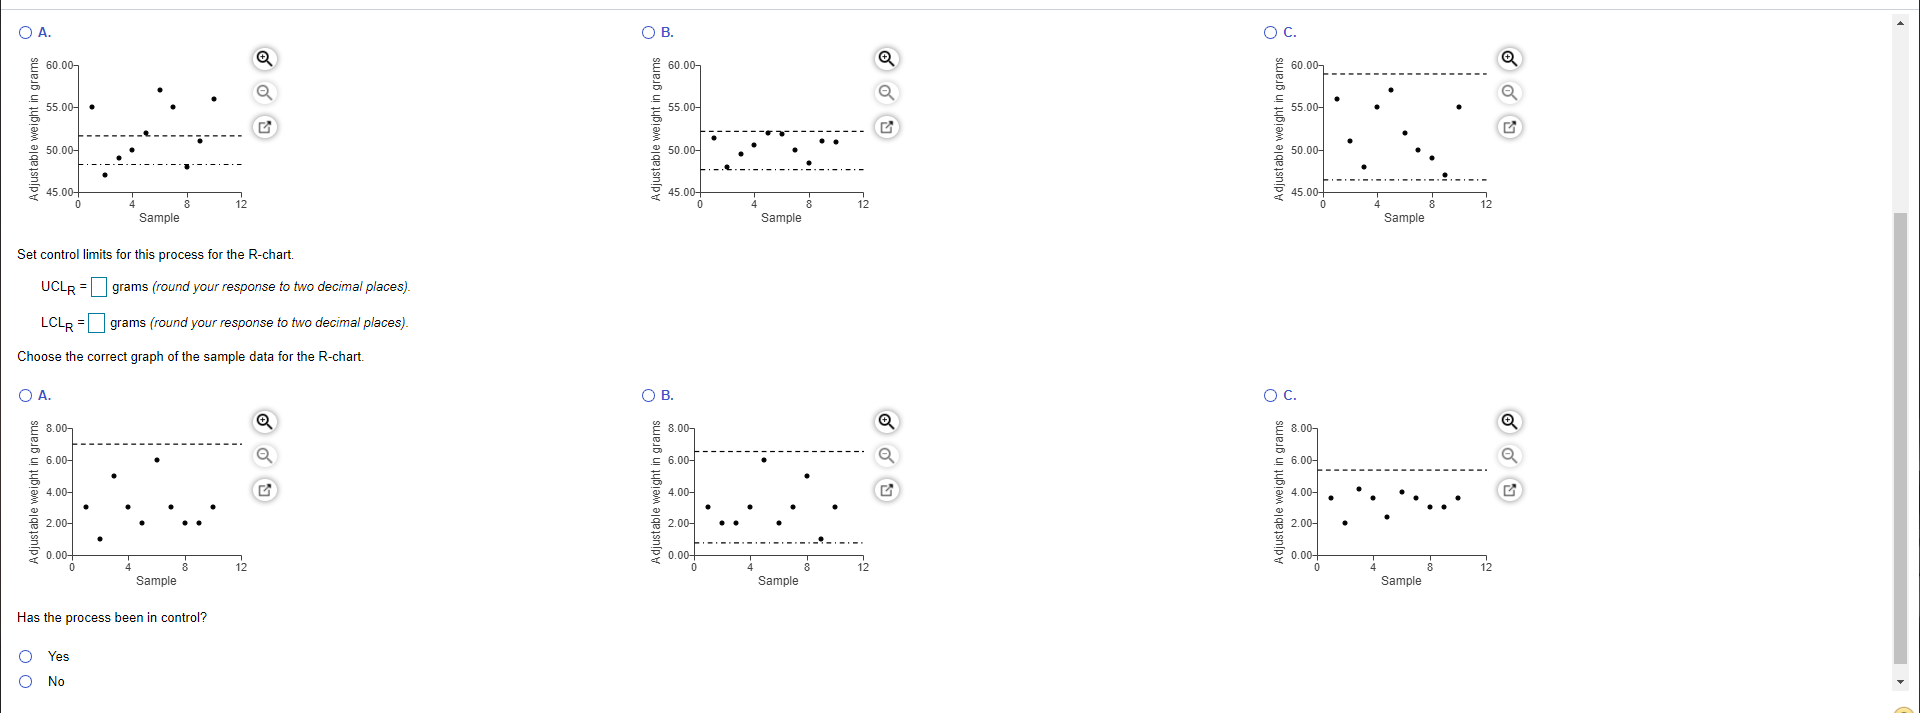
Question: Please show work so I can know how this should be computed, thank you! Data table Question i Data Table - X Lower Range, D3
Please show work so I can know how this should be computed, thank you!
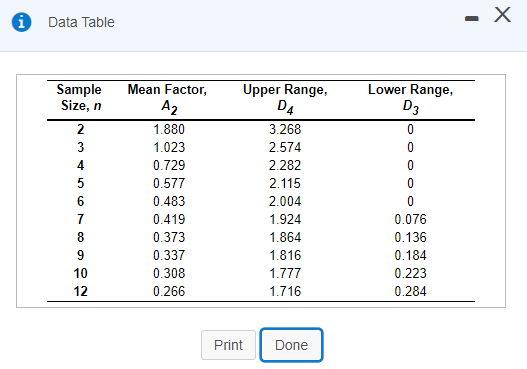
Data table
Question
Step by Step Solution
There are 3 Steps involved in it
1 Expert Approved Answer
Step: 1 Unlock

Question Has Been Solved by an Expert!
Get step-by-step solutions from verified subject matter experts
Step: 2 Unlock
Step: 3 Unlock