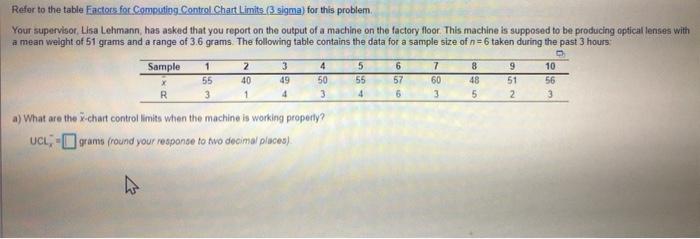
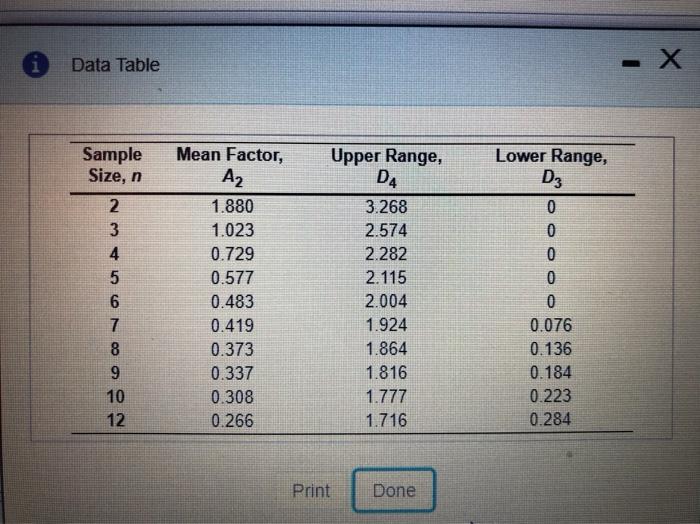
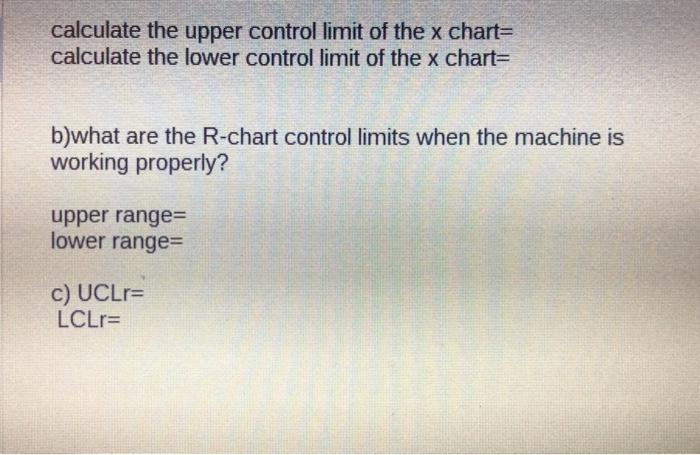
Question: Refer to the table Factors for Computing Control Chart Limits (3 sigma) for this problem Your supervisor, Lisa Lehmann, has asked that you report on

Refer to the table Factors for Computing Control
Refer to the table Factors for Computing Control Chart Limits (3 sigma) for this problem Your supervisor, Lisa Lehmann, has asked that you report on the output of a machine on the factory floor. This machine is supposed to be producing optical lenses with a mean weight of 51 grams and a range of 3.6 grams. The following table contains the data for a sample size of n= 6 taken during the past 3 hours Sample 4 7 1 55 3 2 40 1 3 49 50 3 5 55 4 6 57 6 60 3 8 48 5 9 51 2 10 56 3 R 4 a) What are the x-chart controllimits when the machine is working properly? UCL, -grams (round your response to no decimal pluces). Data Table Sample Size, n 2 3 4 5 6 7 8 9 10 12 Mean Factor, Az 1.880 1.023 0.729 0.577 0.483 0.419 0.373 0.337 0.308 0.266 Upper Range, D4 3.268 2.574 2.282 2.115 2.004 1.924 1.864 1.816 1.777 1.716 Lower Range, D3 0 0 0 0 0 0.076 0.136 0.184 0.223 0.284 Print Done calculate the upper control limit of the x chart= calculate the lower control limit of the x chart= b)what are the R-chart control limits when the machine is working properly? upper range= lower range= c) UCLr= LCLr=

Step by Step Solution

There are 3 Steps involved in it

1 Expert Approved Answer
Step: 1 Unlock blur-text-image
Question Has Been Solved by an Expert!

Get step-by-step solutions from verified subject matter experts

Step: 2 Unlock
Step: 3 Unlock

Students Have Also Explored These Related General Management Questions!