

Question: Please provide excel raw data with plots Problem: Continuous Diafiltration Assume the concentration of protein, Co,1 = 1.0 gm/liter, and rejection coefficient, 01 = 0.8,
 Please provide excel raw data with plots
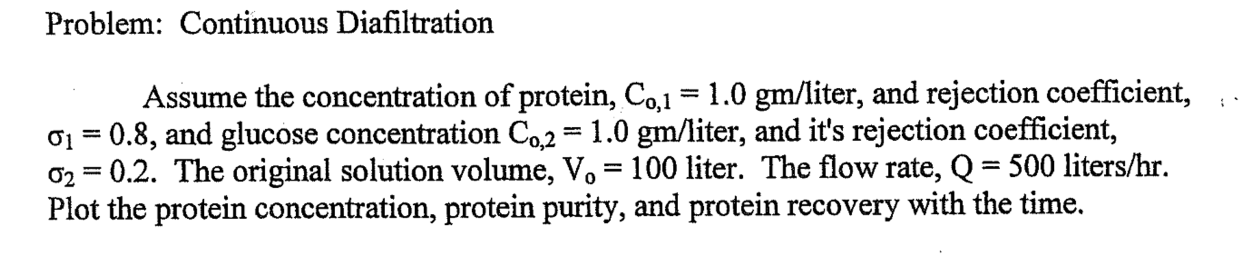
Problem: Continuous Diafiltration Assume the concentration of protein, Co,1 = 1.0 gm/liter, and rejection coefficient, 01 = 0.8, and glucose concentration C0,2 = 1.0 gm/liter, and it's rejection coefficient, 02 = 0.2. The original solution volume, Vo = 100 liter. The flow rate, Q = 500 liters/hr. Plot the protein concentration, protein purity, and protein recovery with the time. = Problem: Continuous Diafiltration Assume the concentration of protein, Co,1 = 1.0 gm/liter, and rejection coefficient, 01 = 0.8, and glucose concentration C0,2 = 1.0 gm/liter, and it's rejection coefficient, 02 = 0.2. The original solution volume, Vo = 100 liter. The flow rate, Q = 500 liters/hr. Plot the protein concentration, protein purity, and protein recovery with the time. =
Step by Step Solution
There are 3 Steps involved in it

Get step-by-step solutions from verified subject matter experts