

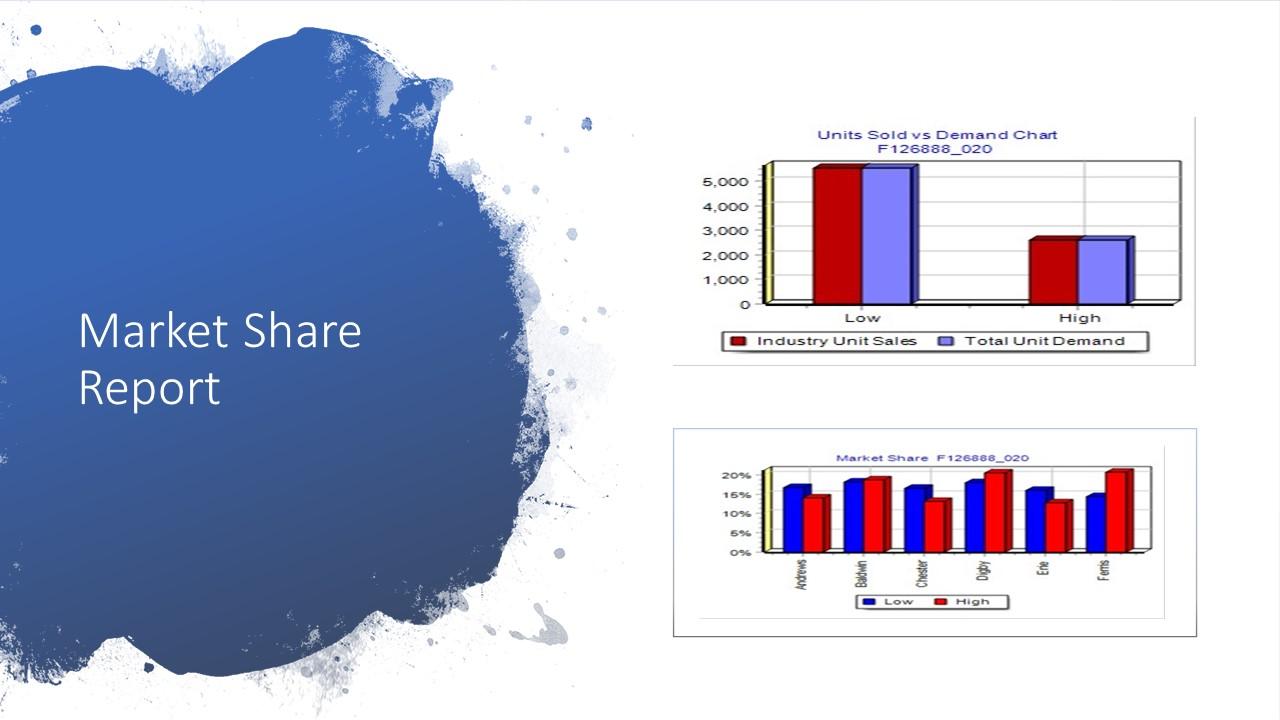
Question: Please provide notes for the slide attached to explain powerpoint slide. Units Sold vs Demand Chart F126888_020 5.000 4.000 3.000 2.000 1.000 o Low High
 Please provide notes for the slide attached to explain powerpoint slide.
Step by Step Solution
There are 3 Steps involved in it
1 Expert Approved Answer
Step: 1 Unlock

Question Has Been Solved by an Expert!
Get step-by-step solutions from verified subject matter experts
Step: 2 Unlock
Step: 3 Unlock