

Question: Please provide step-by-step. a) Develop a scatter diagram using the total number of shipments and the number of defective shipments. Does there appear to be
Please provide step-by-step.
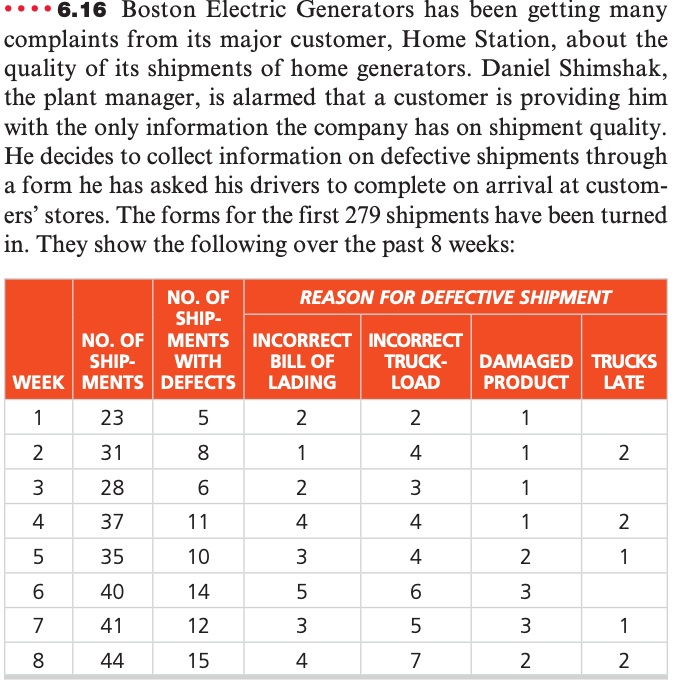
a) Develop a scatter diagram using the total number of shipments and the number of defective shipments. Does there appear to be any relationship?
b) Develop a scatter diagram using the variable turnover (number of new hires plus number of terminations) and the number of defective shipments. Does the diagram depict a relationship between the two variables?
c) Develop a Pareto chart for the type of defects that have occurred.
6.16 Boston Electric Generators has been getting many complaints from its major customer, Home Station, about the quality of its shipments of home generators. Daniel Shimshak, the plant manager, is alarmed that a customer is providing him with the only information the company has on shipment quality. He decides to collect information on defective shipments through a form he has asked his drivers to complete on arrival at customers' stores. The forms for the first 279 shipments have been turned in. They show the following over the past 8 weeksStep by Step Solution
There are 3 Steps involved in it
1 Expert Approved Answer
Step: 1 Unlock

Question Has Been Solved by an Expert!
Get step-by-step solutions from verified subject matter experts
Step: 2 Unlock
Step: 3 Unlock