Question: Please read attached case study. Assignment questions are: 1. Critically analyze the strategic position of Kunapipi Gardens. 2. What are the pros and cons of
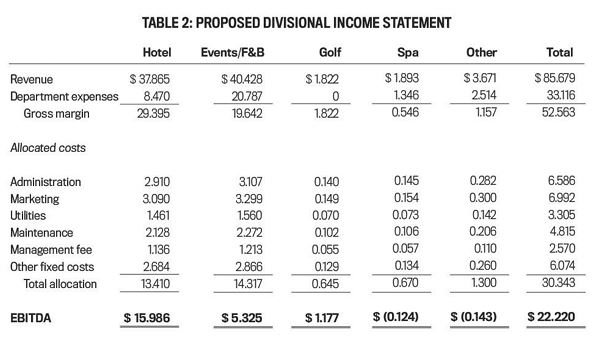
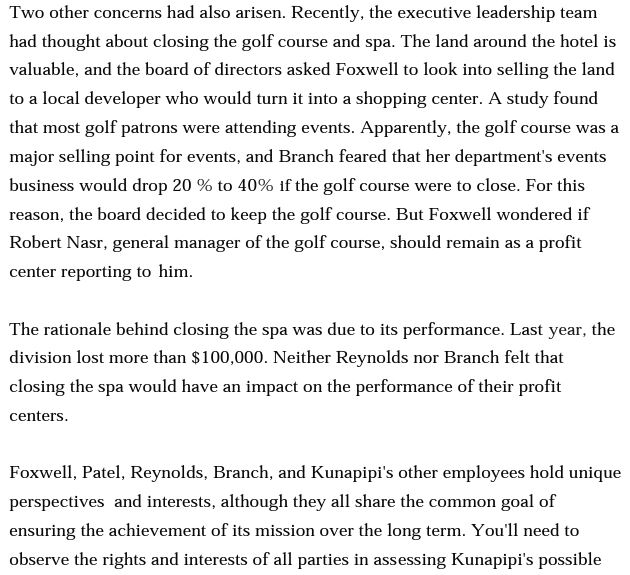
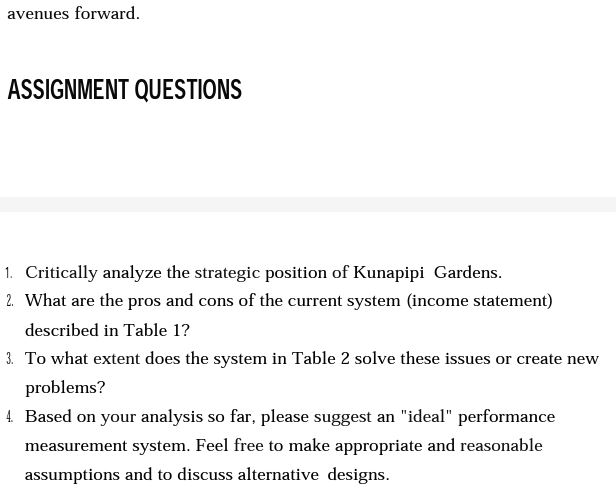
Please read attached case study. Assignment questions are: 1. Critically analyze the strategic position of Kunapipi Gardens. 2. What are the pros and cons of the current system (income statement) described in Table 1? 3. To what extent does the system in Table 2 solve these issues or create new problems? 4. Based on your analysis so far, please suggest an "ideal" performance measurement system. Feel free to make appropriate and reasonable assumptions and to discuss alternative designs.
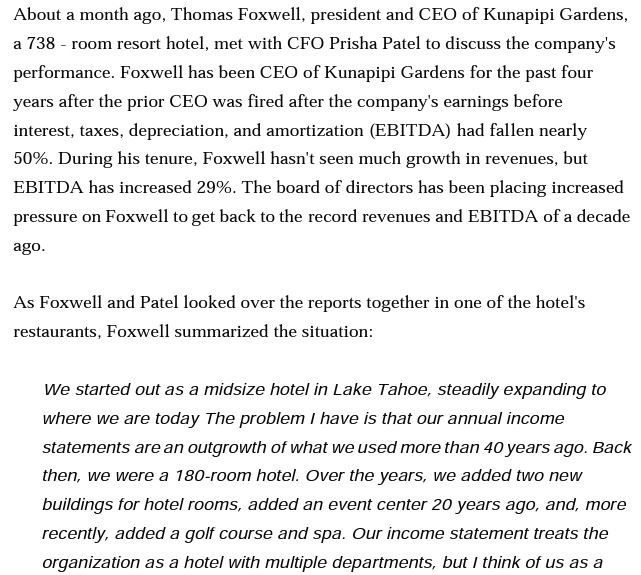
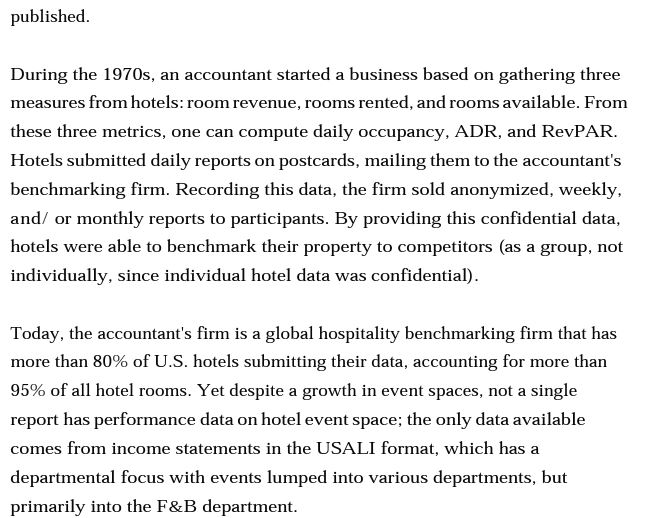
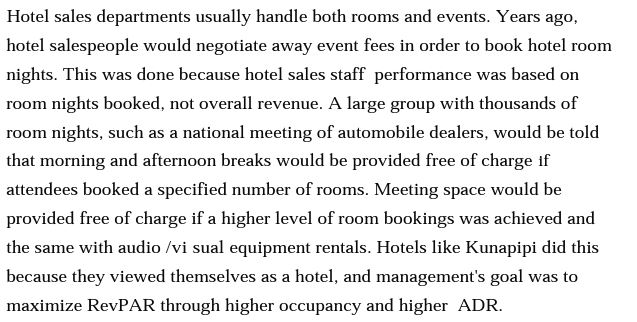
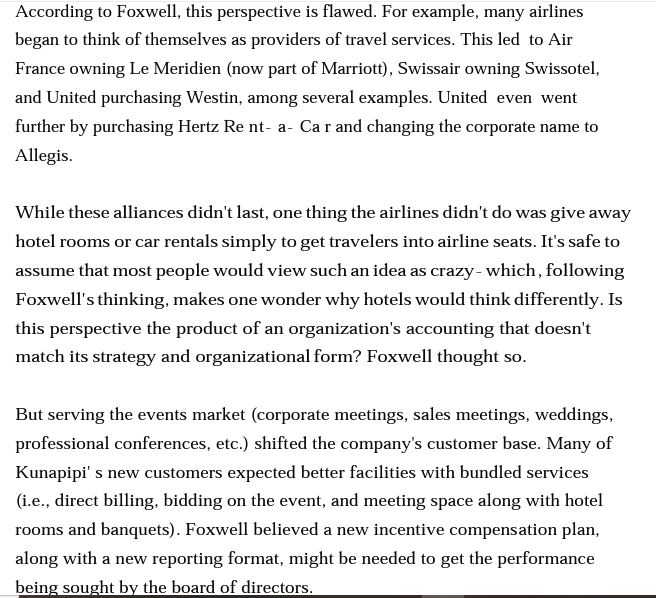
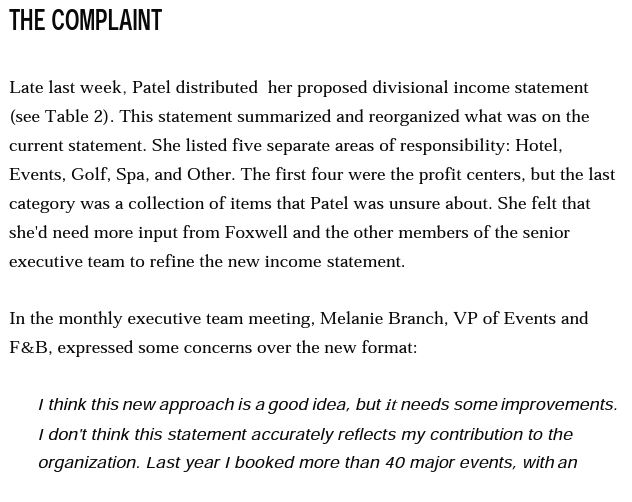
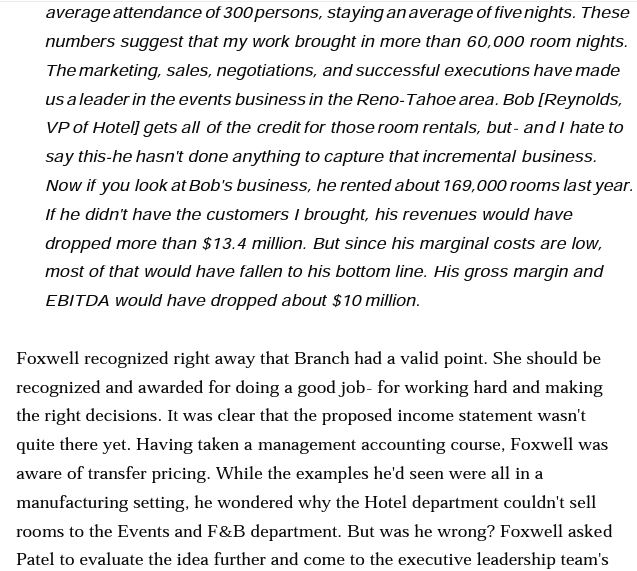
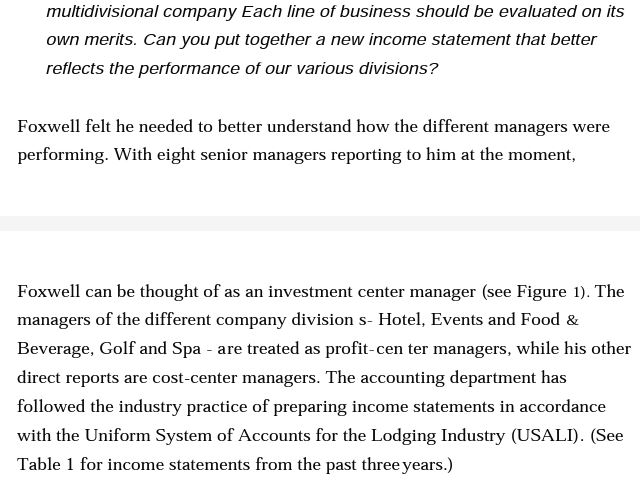
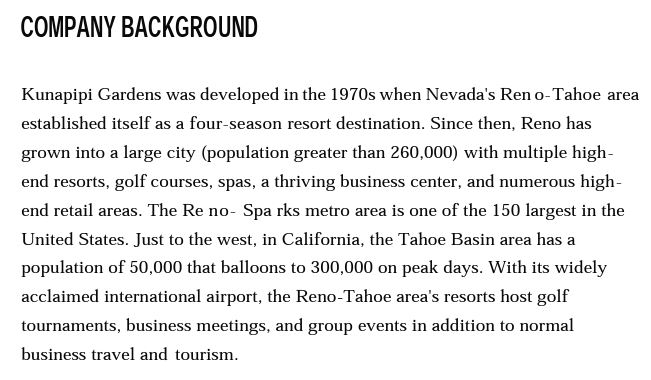
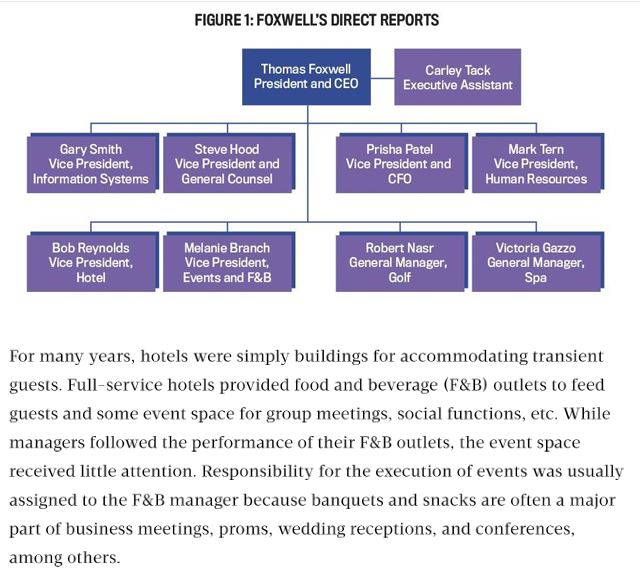
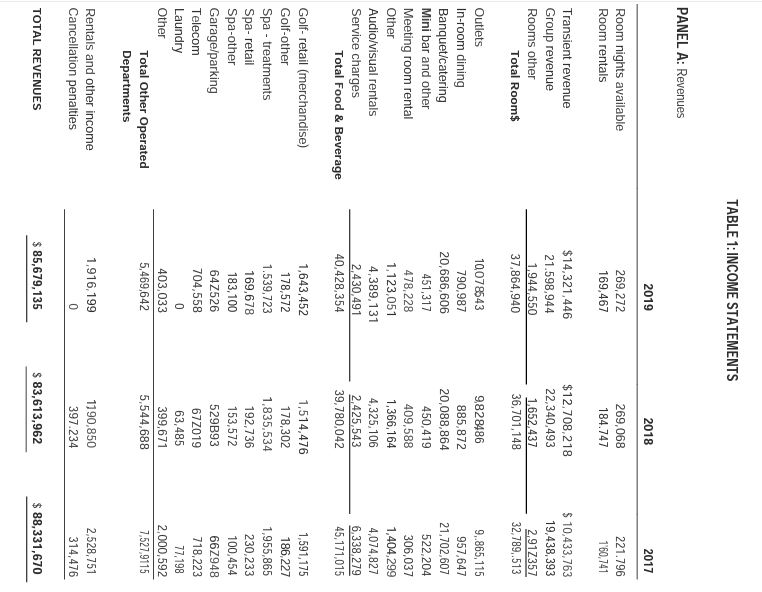
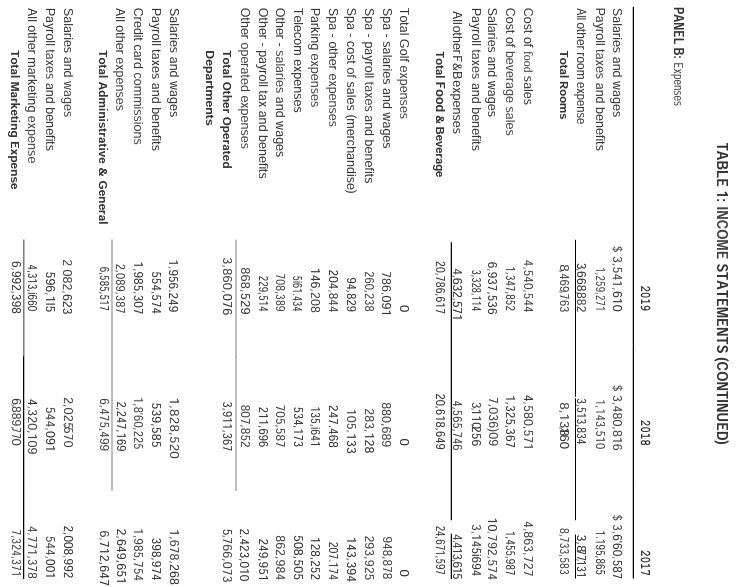
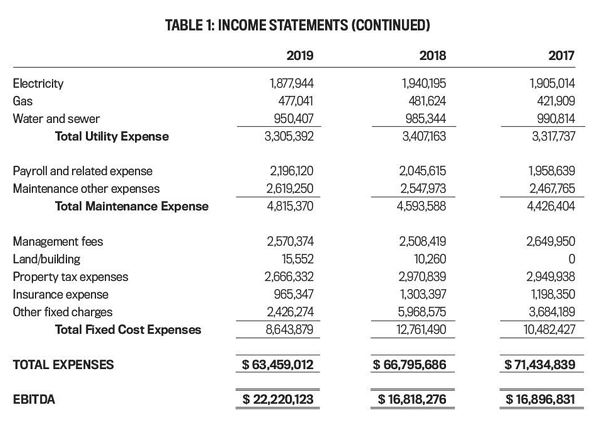
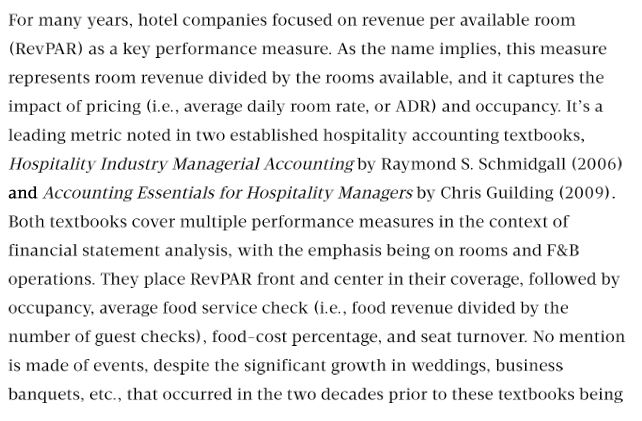
About a month ago, Thomas Foxwell, president and CEO of Kunapipi Gardens, a 738 - room resort hotel, met with CFO Prisha Patel to discuss the company's performance. Foxwell has been CEO of Kunapipi Gardens for the past four years after the prior CEO was fired after the company's earnings before interest, taxes, depreciation, and amortization (EBITDA) had fallen nearly 50%. During his tenure, Foxwell hasn't seen much growth in revenues, but EBITDA has increased 29%. The board of directors has been placing increased pressure on Foxwell to get back to the record revenues and EBITDA of a decade ago. As Foxwell and Patel looked over the reports together in one of the hotel's restaurants, Foxwell summarized the situation: We started out as a midsize hotel in Lake Tahoe, steadily expanding to where we are today The problem I have is that our annual income statements are an outgrowth of what we used more than 40 years ago. Back then, we were a 180-room hotel. Over the years, we added two new buildings for hotel rooms, added an event center 20 years ago, and, more recently, added a golf course and spa. Our income statement treats the organization as a hotel with multiple departments, but I think of us as apublished. During the lQTDs, an accountant started a business based on gathering three measures from hotels: room revenue, rooms rented, and rooms available. From these three metrics, one can compute daily occupancy, ADE, and RevPAR. Hotels submitted daily reports on postcards, mailing them to the accountant's benchmarking firm. Recording this data, the rm sold anonymized, weekly, and! or monthly reports to participants. By providing this confidential data, hotels were able to benchmark their property to competitors (as a group, not individually, since individual hotel data was confidential). Today, the accountant's firm is a global hospitality benchmarking firm that has more than save of 1.1.5. hotels submitting their data, accounting for more than 95% of all hotel rooms. Yet despite a growth in event spaces, not a single report has performance data on hotel event space; the only data available comes from income statements in the USALI format, which has a departmental focus with events lumped into various departments, but primarily into the FEcE department, Hotel sales departments usually handle both rooms and events. Years ago, hotel salespeople would negotiate away event fees in order to book hotel room nights. This was done because hotel sales staff performance was based on room nights booked, not overall revenue. A large group with thousands of room nights, such as a national meeting of automobile dealers, would be told that morning and afternoon breaks would be provided free of charge if attendees booked a specified number of rooms. Meeting space would be provided free of charge if a higher level of room bookings was achieved and the same with audio fvi sual equipment rentals. Hotels like Kunapipi did this because they viewed themselves as a hotel, and management's goal was to maximize RevPAR through higher occupancy and higher AER. According to Foxwell, this perspective is flawed. For example, many airlines began to think of themselves as providers of travel services. This led to Air France owning Le Meridien {now part of Marriott}, Swissair owning Swissotel, and United purchasing Westin, among several examples. United even went further by purchasing Hertz Re nt- a- Ca r and changing the corporate name to Allegis. While these alliances didn't last, one thing the airlines didn't do was give away hotel rooms or car rentals simply to get travelers into airline seats. It's safe to assume that most people would view such an idea as crazy - which, following Foxwell' s thinking, makes one wonder why hotels would think differently. Is this perspective the product of an organization's accounting that doesn't match its strategy and organizational form"?I Foxwell thought so. But serving the events market (corporate meetings, sales meetings, weddings, professional conferences, etc.) shifted the company's customer base. Many of Kunapipi' s new customers expected better facilities with bundled services {i.e., direct billing, bidding on the event, and meeting space along with hotel rooms and banquets). Foxwell believed a new incentive compensation plan, along with a new reporting format, might be needed to get the performance being sought by the board of directors. \fTHE COMPLAINT Late last week, Patel distributed her proposed divisional income statement [see Table 2}. This statement summarized and reorganized what was on the current statement. She listed five separate areas of responsibility: Hotel. Events, Golf, Spa, and Other. The first four were the profit centers. but the last category was a collection of items that Patel was unsure about. She felt that she'd need more input from Foxwell and the other members of the senior executive team to refine the new income statement. In the monthlyr executive team meeting, Melanie Branch, VP of Events and 138:3, expressed some concerns over the new format: i think this new approach is a giooor idea. but it needs some improvements. i don't think this statement accurateiy retiects my contribution to the organization. Last year t hooked more than 4t] major events. with an average attendance of 300 persons, staying an average of five nights. These numbers suggest that my work brought in more than 60,000 room nights. The marketing, sales, negotiations, and successful executions have made us a leader in the events business in the Reno-Tahoe area. Bob [Reynolds, VP of Hotel] gets all of the credit for those room rentals, but- and I hate to say this-he hasn't done anything to capture that incremental business. Now if you look at Bob's business, he rented about 169,000 rooms last year. If he didn't have the customers I brought, his revenues would have dropped more than $13.4 million. But since his marginal costs are low, most of that would have fallen to his bottom line. His gross margin and EBITDA would have dropped about $10 million. Foxwell recognized right away that Branch had a valid point. She should be recognized and awarded for doing a good job- for working hard and making the right decisions. It was clear that the proposed income statement wasn't quite there yet. Having taken a management accounting course, Foxwell was aware of transfer pricing. While the examples he'd seen were all in a manufacturing setting, he wondered why the Hotel department couldn't sell rooms to the Events and F&B department. But was he wrong? Foxwell asked Patel to evaluate the idea further and come to the executive leadership team'smeeting the next month with a revised income statement that would incorporate a transfer price that the two managers [Branch and Reynolds] could agree upon. Foxwell also thought that a revised divisional income statement like the one proposed by Patel might require a new incentive compensation scheme for Kunapipi's senior leadership. Under the current arrangement, the executives receive a bonus based on EBITDA. The idea is to align the interest of the executives with that of Kunapipi's owners. But Foxwell wondered whether a decentralized organization should have a compensation plan where divisional VPs have their bonus based on divisional performance rather than corporate performance. If so, he wondered whether this might adversely,r impact organizational loyalty and increase fighting among the company's senior leadership. Perhaps a blended approach would work best. Foxwell thought that he and his team needed to consider the compensation plan carefull}r before any changes were made. Two other concerns had also arisen. Recently, the executive leadership team had thought about closing the golf course and spa. The land around the hotel is valuable, and the board of directors asked Foxwell to look into selling the land to a local developer who would turn it into a shopping center. A study found that most golf patrons were attending events. Apparently, the golf course was a major selling point for events, and Branch feared that her department's events business would drop 2D W: to 4% if the golf course were to close. For this reason, the board decided to keep the golf course. But Foxwell wondered if Robert Nasr, general manager of the golf course, should remain as a profit center reporting to him. The rationale behind closing the spa was due to its performance. Last year. the division lost more than $1D,DD. Neither Reynolds nor Branch felt that closing the spa would have an impact on the performance of their profit CEI'HIEI'S . Foxwell, Patel, Reynolds, Branch, and Kunapipi's other employees hold unique perspectives and interests, although they all share the common goal of ensuring the achievement of its mission over the long term. You'll need to observe the rights and interests of all parties in assessing Kunapipi's possible ave nu es forward. ASSIGNMENT QUESTIONS 1. Critically analyze the strategic position of Kunapipi Gardens. EH3 What are the pros and cons of the current system {income statement) described in Table 1? 3. To what extent does the system in Table 2 solve these issues or create new problems? Ii Based on your analysis so far, please suggest an "ideal" performance measurement system. Feel free to make appropriate and reasonable assumptions and to discuss alternative designs. mottidivisr'onat company Each tine of business should he errata-ates:r on its own merits. Can you put together a new income statement that better reects the performance of our various divisions ? Foxwell felt he needed to better understand how the different managers were performing. With eight senior managers reporting to him at the moment. Foxwell can be thought of as an investment center manager [see Figure l}. The managers of the different company division 5 Hotel. Events and Food 3: Beverage, Golf and Spa - are treated as profit-can ter managers+ while his other direct reports are costcenter managers. The accounting department has followed the industry practice of preparing income statements in accordance with the Uniform System of Accounts for the Lodging Industry [USALIL {See Table 1 for income statements from the past three years.) COMPANY BACKGROUND Kunapipi Gardens was developed in the 10T0s when Nevada's Ren o-Tahoe area established itself as a fourseason resort destination. Since then, Reno has grown into a large city {population greater than 200,000] with multiple high- end resorts, golf courses, spas, a thriving business center, and numerous high- end retail areas. The Re no Spa rks metro area is one of the 150 largest in the United States. Just to the west, in California, the Tahoe Basin area has a population of 50,000 that balloons to 300,000 on peak days. 1Lt'v'ith its widel},r acclaimed international airport, the Reno-Tahoe area's resorts host golf tournaments, business meetings, and group events in addition to normal business travel and tourism. FIGURE 1: FOXWELL'S DIRECT REPORTS Thomas Foxwell Carley Tack President and CEO Executive Assistant Gary Smith Steve Hood Prisha Patel Mark Tern Vice President, Vice President and Vice President and Vice President, Information Systems General Counsel CFO Human Resources Bob Reynolds Melanie Branch Robert Nasr Victoria Gazzo Vice President, Vice President, General Manager, General Manager. Hotel Events and F&B Golf Spa For many years, hotels were simply buildings for accommodating transient guests. Full-service hotels provided food and beverage (F&B) outlets to feed guests and some event space for group meetings, social functions, etc. While managers followed the performance of their F&B outlets, the event space received little attention. Responsibility for the execution of events was usually assigned to the F&B manager because banquets and snacks are often a major part of business meetings, proms, wedding receptions, and conferences, among others.Throughout the 1980s, many full-service hotels viewed their event space as an adjunct to their principal line of business (providing rooms for travelers). Similar to casinos in the 1960s, where the hotel was seen as an adjunct to their gaming business (to keep gamblers at the hotel, rooms were "comped," or provided free), hotels typically focused on maximizing hotel room occupancy (i.e., rooms rented divided by rooms available, a measure of capacity utilization) while ignoring event space utilization. Prior to the pandemic, hotel occupancy rates averaged 80% while 30% of event space was utilized.TABLE 1: INCOME STATEMENTS PANEL A: Revenues 2019 2018 2017 Room nights available 269,272 269,068 221.796 Room rentals 169,467 184.747 1'60,741 Transient revenue $14,321,446 $12.708,218 $ 10,433,763 Group revenue 21.598,944 22,340,493 19,438,393 Rooms other 1,944,550 1.652,437 2,917357 Total Rooms 37,864,940 36,701,148 32,789,.513 Outlets 10,078543 9.828486 9,.865, 115 In-room dining 790,987 885,872 957,647 Banquet/catering 20,686,606 20,088,864 21,702,607 Mini bar and other 451,317 450,419 522,204 Meeting room rental 478,228 409,588 306,037 Other 1,123,051 1,366,164 1,404,299 Audio/visual rentals 4,389,131 4,325.106 4,074,827 Service charges 2,430,491 2,425,543 6,338.279 Total Food & Beverage 40,428,354 39,780,042 45, 171,015 Golf- retail (merchandise) 1,643,452 1,514,476 1,591,175 Golf-other 178,572 178,302 186,227 Spa - treatments 1.539,723 1.835,534 1,955,865 Spa- retail 169,678 192,736 230,233 Spa-other 183, 100 153,572 100,454 Garage/parking 642526 529893 667948 Telecom 704,558 672019 718,223 Laundry C 63,485 77,198 Other 403,033 399,671 2,000,592 Total Other Operated 5,469,642 5,544,688 7,527,9115 Departments Rentals and other income 1,916,199 1190,850 2.528,751 Cancellation penalties 397.234 314,476 TOTAL REVENUES $ 85,679,135 $ 83,613,962 $ 88,331,670TABLE 1: INCOME STATEMENTS (CONTINUED) PANEL B: Expenses 2019 2018 2017 Salaries and wages $ 3,541,610 $ 3,480,816 $ 3,6'60,587 Payroll taxes and benefits 1,259.271 1,143,510 1.195,865 All other room expense 3668882 3.513,834 3,7 7131 Total Rooms 8 469763 8, 13860 8,733,583 Cost of food sales 4 540.544 4,580,571 4,863,727 Cost of beverage sales 1,347,852 1,325,367 1,455,987 Salaries and wages 6,937,536 7,036)09 10,792.574 Payroll taxes and benefits 3,328, 114 311(256 3,1451694 Allother F & Bexpenses 4.632.571 4,565,746 4.413,615 Total Food & Beverage 20,786,617 20,618,649 24,671,597 Total Golf expenses C Spa - salaries and wages 786,091 880,689 948,878 Spa - payroll taxes and benefits 260,238 283,128 293,925 Spa - cost of sales (merchandise) 94.829 105.133 143,394 Spa - other expenses 204,844 247.468 207.174 Parking expenses 146,208 135,1641 128,252 Telecom expenses 5161.434 534,173 508,505 Other - salaries and wages 708,389 705,587 862,984 Other - payroll tax and benefits 229,514 211,696 249,951 Other operated expenses 868,529 807,852 2.423,010 Total Other Operated 3,860,076 3,911,367 5,766,073 Departments Salaries and wages 1,956.249 1,828,520 1,678,268 Payroll taxes and benefits 554,574 539,585 398,974 Credit card commissions 1,985,307 1,8'60,225 1,985,754 All other expenses 2,089,387 2,247,169 2.649,651 Total Administrative & General 6,585,517 6,475,499 6,712,647 Salaries and wages 2 082.623 2,025670 2,008,992 Payroll taxes and benefits 596, 115 544,091 544,001 All other marketing expense 4,313,1660 4,320,109 4,771,378 Total Marketing Expense 6,992,398 6,889770 7,324,371TABLE 1: INCOME STATEMENTS (CONTINUED) 2019 2018 2017 Electricity 1,877.944 1,940,195 1,905.014 Gas 477.041 481.624 421,909 Water and sewer 950,407 985.344 990.814 Total Utility Expense 3,305,392 3,407,163 3,317,737 Payroll and related expense 2.196.120 2,045.615 1.958,639 Maintenance other expenses 2,619.250 2.547,973 2.467.765 Total Maintenance Expense 4.815,370 4.593.588 4,426,404 Management fees 2.570,374 2.508,419 2.649,950 Land/building 15.552 10.260 0 Property tax expenses 2.666,332 2.970,839 2,949,938 Insurance expense 965,347 1,303,397 1,198,350 Other fixed charges 2.426.274 5.968.575 3.684.189 Total Fixed Cost Expenses 8.643,879 12.761,490 10,482,427 TOTAL EXPENSES $ 63,459,012 $ 66,795.686 $ 71,434,839 EBITDA $ 22,220,123 $ 16,818,276 $ 16,896,831For many years, hotel companies focused on revenue per available room (RevPAR) as a key performance measure. As the name implies, this measure represents room revenue divided by the rooms available, and it captures the impact of pricing (i.e., average daily room rate, or ADR) and occupancy. It's a leading metric noted in two established hospitality accounting textbooks, Hospitality Industry Managerial Accounting by Raymond S. Schmidgall (2006) and Accounting Essentials for Hospitality Managers by Chris Guilding (2009). Both textbooks cover multiple performance measures in the context of financial statement analysis, with the emphasis being on rooms and F&B operations. They place RevPAR front and center in their coverage, followed by occupancy, average food service check (i.e., food revenue divided by the number of guest checks), food-cost percentage, and seat turnover. No mention is made of events, despite the significant growth in weddings, business banquets, etc., that occurred in the two decades prior to these textbooks being
Step by Step Solution
There are 3 Steps involved in it
1 Expert Approved Answer
Step: 1 Unlock
Question Has Been Solved by an Expert!
Get step-by-step solutions from verified subject matter experts
Step: 2 Unlock
Step: 3 Unlock
Students Have Also Explored These Related Accounting Questions!