Question: Please read the following case and then write an analysis of the industry's attractiveness using Porters 5-force model 1. Threat of New Entrants 2. Threat
Please read the following case and then write an analysis of the industry's attractiveness using Porters 5-force model
1. Threat of New Entrants
2. Threat of susbsitutes
3. Bargaining power of buyers
4. Bargaining power of suppliers
5. Industry rivals
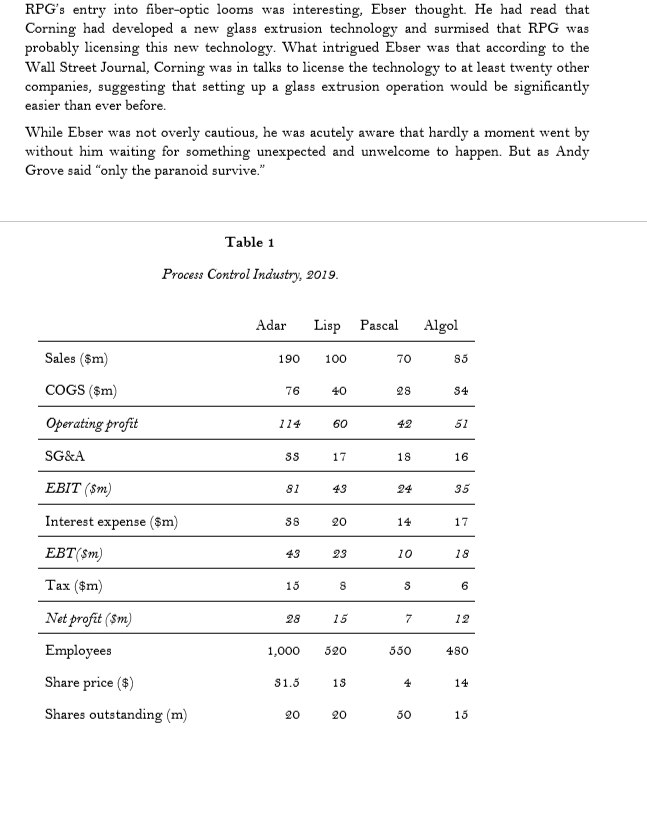
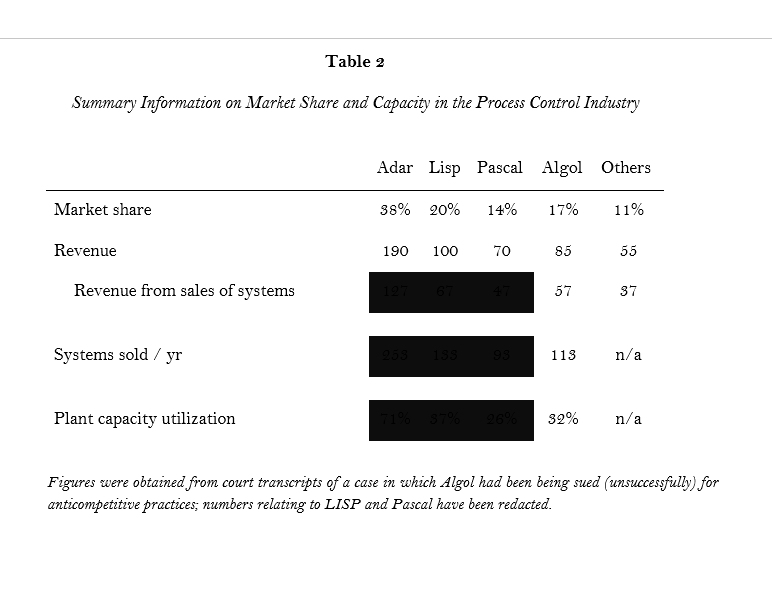
Dick Ebser, Adar's CEO, had good reason to feel satisfied. Negotiations had gone well and the meeting had ended with a commitment to merge the company he had taken over just two years earlier with Algol, one of Adar's two major competitors. The new combined entity would have revenues of $275m and a market share of 55%. There were still things to worry about. Dplus Inc, who had once been one of their best customers, was thinking about building its own control systems for some though not all) of its plants. Other changes were in the offing; RPG, a large conglomerate had just announced that it would be opening a facility to produce fiber optic wiring looms. And there was a chance, albeit a long shot that the new administration might pass legislation that could in several years, create an increase of anything from 20% to 40% in industry demand, depending on which economist you listened to. There was a palpable air of excitement at Adar that Ebser fed fromit kept him energized though the 18-hour days that the merger demanded of him. Adar made heating control and monitoring systems for a wide variety of industrial customers mainly in process manufacturing Adar's customers ranged from large corporations like Friedly, a large bakery that supplied Safeway, Asda and Tesco in the UK, and Shackelton Plastics who made injection molded components for the toy industry, to a large number of medium size and small companies making things as disparate as golf balls, bicycle tires, sports dietary supplements and paint. About 75% of Adar's sales came from its largest 20 customers. A typical Adar control system comprised an array of optical sensors placed at intervals in the customer's production line. These were linked to the controller with a fiber optic loom!. The rest of the installation comprised a microprocessor based control unit and a monitor (or monitors in larger systems) that Adar built into the system console according to the to the customers' specifications. The system was designed to link to a variety of production control systems using industry standard interface protocols. Although Adar was the only company in the industry using fiber optical connections from its sensors (its competitors used copper wire) it had not yet fully exploited the advantages of optical fiber. While this gave them potential for producing a much more advanced system in the future, as yet, there was little to distinguish Adar's product from those of its main competitors; functionally they were pretty similar. Adar provided significant after sales support for its installations. Over the years, its support teams had developed considerable understanding of the needs of both the baking and injection molding industries. Lisp, Adar's main competitor had begun to focus its efforts on the auto industry, which had a variety of highly specialized needs. Lisp was well placed for the automakers with its headquarters in Dearborn, MI. Pascal, based in Dallas, had also begun to acquire particular industry knowledge with customers that included Chevron, Exxon, BP and Texaco. Some information about the leading firms in the industry is shown in Table 1. About a third of Adar's revenues came from the sale of equipment and the initial installation and almost two thirds came from ongoing maintenance contracts. Although each system 1 Wiring loom: A bundle of cables, pre-fabricated to save time on site. (A Dictionary of Building. Penguin, 1974) was tailor-made to a customer's specification and so prices varied, a typical single process monitoring system cost about $500k. Several factors were important to success in this industry. The first was scale. A typical modern assembly plant, operating at its point of minimum efficient scale, could build about seven systems a week. Operating at less than 70% utilization had a considerable impact on profitabilityfirms that could not meet this level of utilization were unlikely to survive for long. (See Table 2). Some of the smaller firms in the industry used older batch production processes with much smaller facilities, but their cost structures were higher and they tended to concentrate on local geographic markets. The second key factor was a reputation for after-sales support Customers running high volume production facilities could not afford a prolonged down-time and a key part of their purchasing decision when buying monitoring equipment was the length of time a potential supplier had been in business and its reputation for fast and efficient service. When buying or replacing a processes monitoring system, customers almost always asked to visit two or three reference sites where they could talk other users of the system to ascertain how satisfied they were. They expected support engineers to be on site within 2-5 hours of a problem. These days, with the increasing sophistication of the monitoring and sensing equipment, it was almost unheard of (and unthinkable) for anyone to buy a system without visiting a site where the vendor's system was installed and working and with most companies in the industry spending over 10% of revenues on R&D, systems were getting ever more sophisticated. Reference visits were easier to arrange when the reference site was in a different industry from that of the potential customer since firms seldom liked allowing their competitors to look over their facilities. The monitors Adar used in its consoles, it bought from a wide variety of sources, depending largely on who was offering the best price that quarter. Only three companies had the technology to make the fiber optic looms Adar needed. PHP and ASP were the longest established firms but RPG's ceramics division had announced plans to begin making the kind of looms Adar needed. The microcontrollers Adar bought from Cypress and Altera. These were two of about ten companies that produced field programmable gate arrays (FPGAs). The FPGA's allowed Adar to update the software that ran the monitoring system as needed over a telephone line or via the Internet. Installation and maintenance was the highest proportion of Adar's cost structure, mainly in labor costs, and accounted for almost half the cost of a new installation. In terms of materials, FPGAs ware the next highest cost component followed by the wiring looms, sensors and finally the displays. There was a certain irony in the acquisition; Adar had been founded 15 years ago by three ex-Algol managers. They had designed their products and indeed the business model on Algol's and now Adar was buying the firm from which it had grown. The companies differed very little in terms of products and services or in the way they were organized; what separated the two was Adar's more aggressive sales marketing With Algol now being merged into Adar, the only other major manufacturers of process control monitoring systems were Lisp, with sales of $100m, and Pascal. The next largest firm was a minnow by comparison with sales of $25m, with a number of smaller firms making up the remainder of the industry. RPG's entry into fiber optic looms was interesting, Ebser thought. He had read that Corning had developed a new glass extrusion technology and surmised that RPG was probably licensing this new technology. What intrigued Ebser was that according to the Wall Street Journal, Corning was in talks to license the technology to at least twenty other companies, suggesting that setting up a glass extrusion operation would be significantly easier than ever before. While Ebser was not overly cautious, he was acutely aware that hardly a moment went by without him waiting for something unexpected and unwelcome to happen. But as Andy Grove said "only the paranoid survive." Table 1 Process Control Industry, 2019. Adar Lisp Pascal Algol Sales ($m) 190 100 70 85 COGS ($m 76 40 28 S4 Operating profit 114 60 42 52 SG&A SS 17 18 16 EBIT ($m) 81 43 24 35 Interest expense ($m S8 20 14 17 EBT($m 43 23 10 18 Tax ($m) 15 8 6 Net profit (sm) 28 15 7 12 1,000 520 550 480 Employees Share price ($) Shares outstanding (m) S1.5 15 4 14 20 20 50 15 Table 2 Summary Information on Market Share and Capacity in the Process Control Industry Adar Lisp Pascal Algol Others Market share 38% 20% 14% 17% 11% Revenue 190 100 70 85 55 Revenue from sales of systems 57 37 Systems sold / yr 113 n/a Plant capacity utilization 32% n/a Figures were obtained from court transcripts of a case in which Algol had been being sued (unsuccessfully) for anticompetitive practices; numbers relating to LISP and Pascal have been redacted


