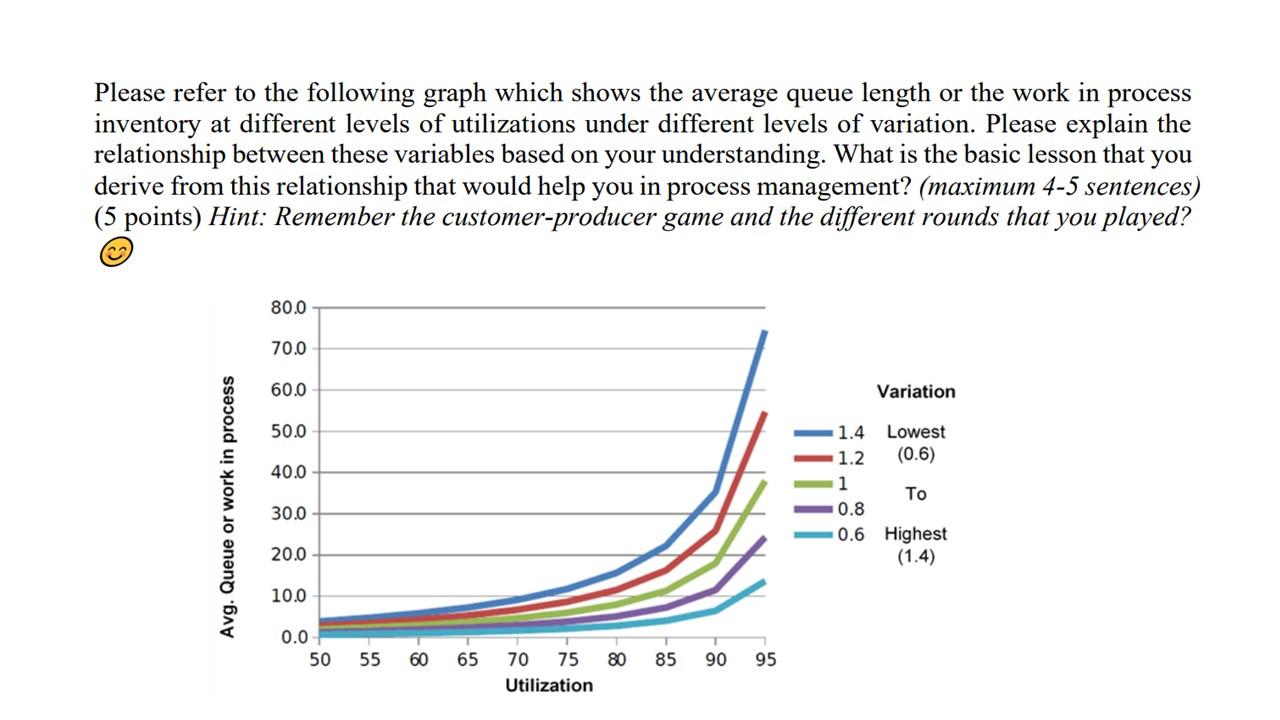
Question: Please refer to the following graph which shows the average queue length or the work in process inventory at different levels of utilizations under different

Please refer to the following graph which shows

Please refer to the following graph which shows the average queue length or the work in process inventory at different levels of utilizations under different levels of variation. Please explain the relationship between these variables based on your understanding. What is the basic lesson that you derive from this relationship that would help you in process management? (maximum 4-5 sentences) (5 points) Hint: Remember the customer-producer game and the different rounds that you played? 80.0 70.0 60.0 Variation 50.0 40.0 Avg. Queue or work in process 1.4 Lowest 1.2 (0.6) 1 To 0.8 0.6 Highest (1.4) 30.0 20.0 10.0 0.0 50 55 60 65 80 85 90 95 70 75 Utilization

Step by Step Solution

There are 3 Steps involved in it

1 Expert Approved Answer
Step: 1 Unlock blur-text-image
Question Has Been Solved by an Expert!

Get step-by-step solutions from verified subject matter experts

Step: 2 Unlock
Step: 3 Unlock

Students Have Also Explored These Related General Management Questions!