

Question: Please reference the image below to help you answer the following question. MAPE for the forecast developed by the nave approach = __________% (round your
Please reference the image below to help you answer the following question.
- MAPE for the forecast developed by the nave approach = __________% (round your response to two decimal places)
- When comparing MAD for the two approaches, the better forecast is achieved using the ______
- When comparing MAPE for the two approaches, the better forecast is achieved using the ______
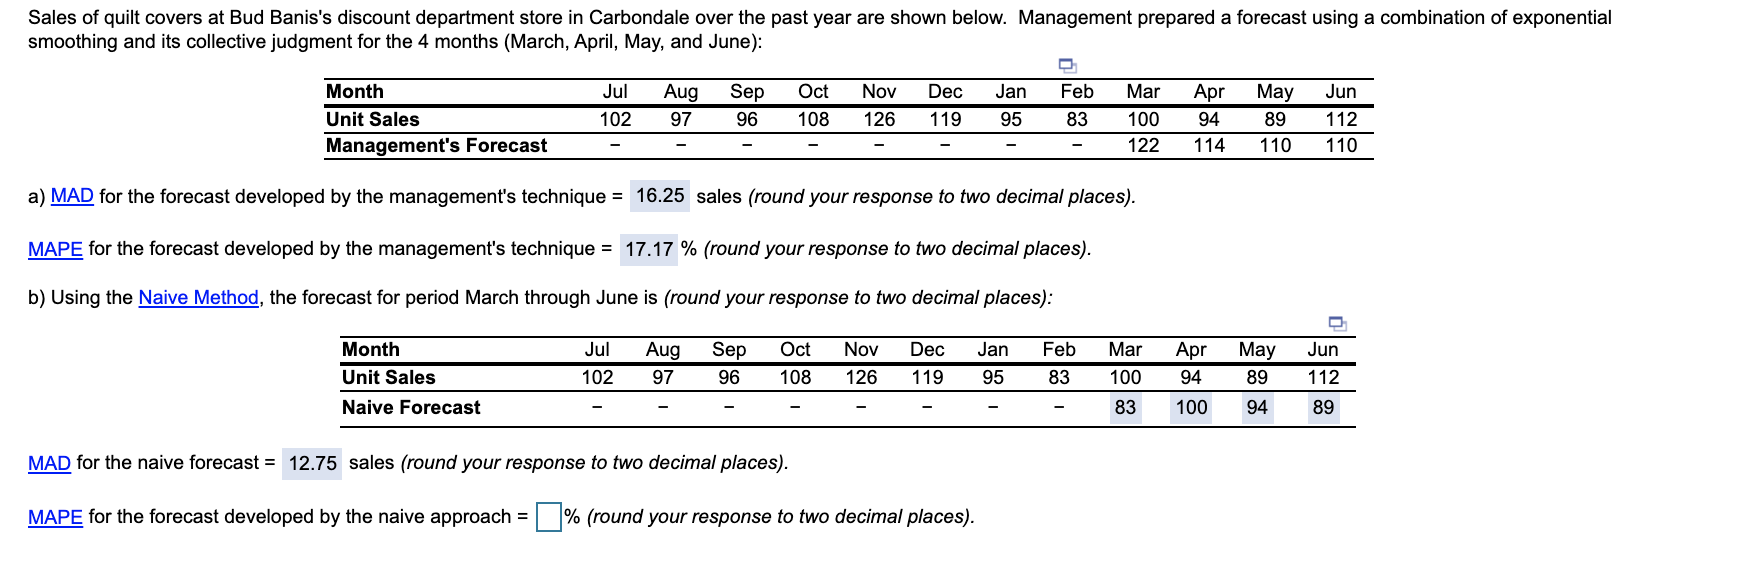
Sales of quilt covers at Bud Banis's discount department store in Carbondale over the past year are shown below. Management prepared a forecast using a combination of exponential smoothing and its collective judgment for the 4 months (March, April, May, and June): Feb Mar Month Unit Sales Management's Forecast Jul 102 Aug 97 Sep 96 Oct 108 Nov 126 Dec 119 Jan 95 Apr 94 83 100 122 May 89 110 Jun 112 110 114 a) MAD for the forecast developed by the management's technique = 16.25 sales (round your response to two decimal places). MAPE for the forecast developed by the management's technique = 17.17 % (round your response to two decimal places). b) Using the Naive Method, the forecast for period March through June is (round your response to two decimal places): Jul Nov Dec Feb Month Unit Sales Naive Forecast Aug 97 Sep 96 Oct 108 Jan 95 Apr 94 May 89 102 126 Mar 100 83 119 83 Jun 112 89 100 94 MAD the naive forecast = .75 sales (round your response to two decimal places). MAPE for the forecast developed by the naive approach = % (round your response to two decimal places)
Step by Step Solution
There are 3 Steps involved in it

Get step-by-step solutions from verified subject matter experts