

Question: Please see attachments. I need help understanding the data I pulled. If you're familiar with SPSS, it may help you First, read case to understand


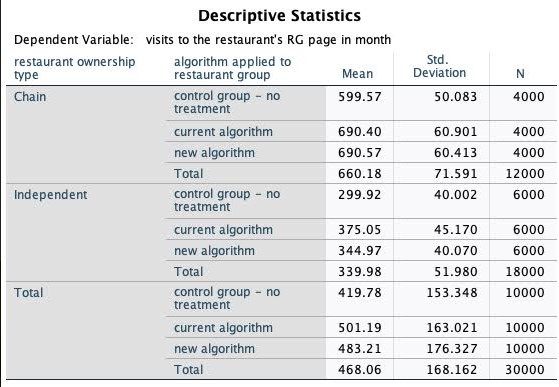
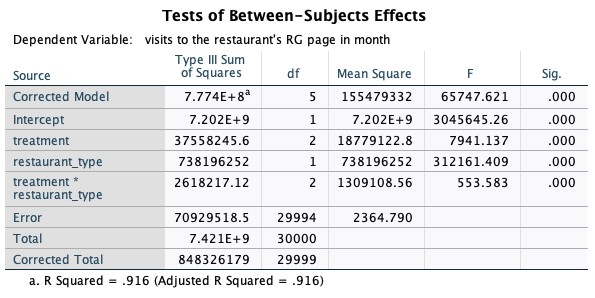
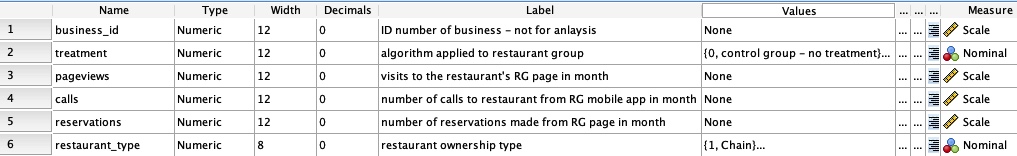
Please see attachments. I need help understanding the data I pulled. If you're familiar with SPSS, it may help you First, read case to understand assignment. Then see all variables used in case. Lastly, see the individual hypothesis that I put together. The 2 independents used are 'treatment' which consists of 3 levels (0=control group-no treatment, 1=current algorithm, and 2=new algorithm) and the 'restaurant_type' variable has 2 levels (1=chain, 2=independent). The dependent variable is number of page visits(pageviews) As I'm reviewing the Sig. (p-value) column, if I'm not mistaken, we can see the p-value for both variables are .000, which is less than .05. Therefore, we can reject the null of no difference and conclude that we have two significant fixed factors. My confusion is what does that mean in layman terms pertaining to page views, restaurant_type, and treatment? Lastly, with all the info provided, how do I read the last screenshot for Descriptive Statistics? We can clearly see that for chain restaurants, the algorithm has the highest mean at 690.57. For independent restaurants, the current algorithm is favored at a mean of 375.05. Overall, the current algorithm draws the most visits to the restaurant's RG page in a month with a mean of 501.19. What am I really saying here? I understand how to spit out the data, but I don't know what it means for this case study and the restaurant ratings website. Thank you. All info is provided and nothing else is missing.
Introductory Comments The case describes a restaurant ratings website and app called RestaurantG rades. The site provides a search engine for consumers to find restaurants according to their tastes, a place to post reviews, find menu and pricing information, contact the restaurant, or make reservations. RestaurantGrades makes money by selling advertising packages that pushes restaurant advertising at site visitors based on their searches and search history. As the case describes, the company wants to compare a new search algorithm against its current algorithm. These algorithms determine what ads a site visitor sees. Read the case carefully, paying extra attention to the design of the experiment, and then look through the attached RestaurantGrades SPSS dataset. Understand how the treatment groups and control group differ from each other in the execution of the experiment. The variable names and descriptions largely match those given in the case itself. However, I made a few labeling changes when converting the case from Excel to SPSS. Your main analytical task is to make a recommendation about whether and how RestaurantGrades should adopt the new algorithm. However, any insights you glean from the data should be reported. Descriptive Statistics Dependent Variable: visits to the restaurant's RG page in month restaurant ownership algorithm applied to Std. type restaurant group Mean Deviation N Chain control group - no 599.57 50.083 4000 treatment current algorithm 690.40 60.901 4000 new algorithm 690.57 60.413 4000 Total 660.18 71.591 12000 Independent control group - no 299.92 40.002 6000 treatment current algorithm 375.05 45.170 6000 new algorithm 344.97 40.070 6000 Total 339.98 51.980 18000 Total control group - no 419.78 153.348 10000 treatment current algorithm 501.19 163.021 10000 new algorithm 483.21 176.327 10000 Total 468.06 168.162 30000Tests of Between-Subjects Effects Dependent Variable: visits to the restaurant's RG page in month Type Ill Sum Source of Squares df Mean Square Sig. Corrected Model 7.774E+8 5 155479332 65747.621 .000 Intercept 7.202E+9 1 7.202E+9 3045645.26 000 treatment 37558245.6 18779122.8 7941.137 .000 restaurant_type 738196252 1 738196252 312161.409 000 treatment * 2618217.12 2 1309108.56 553.583 000 restaurant_type Error 70929518.5 29994 2364.790 Total 7.421E+9 30000 Corrected Total 848326179 29999 a. R Squared = .916 (Adjusted R Squared = .916)Name Type Width Decimals Label Values Measure business_id Numeric 12 0 ID number of business - not for anlaysis None Scale NJ treatment Numeric 12 algorithm applied to restaurant group (0, control group - no treatment)... Nominal 3 pageviews Numeric 12 visits to the restaurant's RG page in month None Scale 4 calls Numeric 12 number of calls to restaurant from RG mobile app in month None Scale 5 reservations Numeric 12 number of reservations made from RG page in month None Scale 6 restaurant_type Numeric 8 0 restaurant ownership type {1, Chain). Nominal
Step by Step Solution
There are 3 Steps involved in it

Get step-by-step solutions from verified subject matter experts